How to Add Density Line on Histogram in R
This tutorial shows how to add density line on histogram in R. The following is the key part of the syntax, which sets freq=FALSE and add line() on the top of the histogram.
hist(data_name, freq =FALSE)
lines(density(data_name))
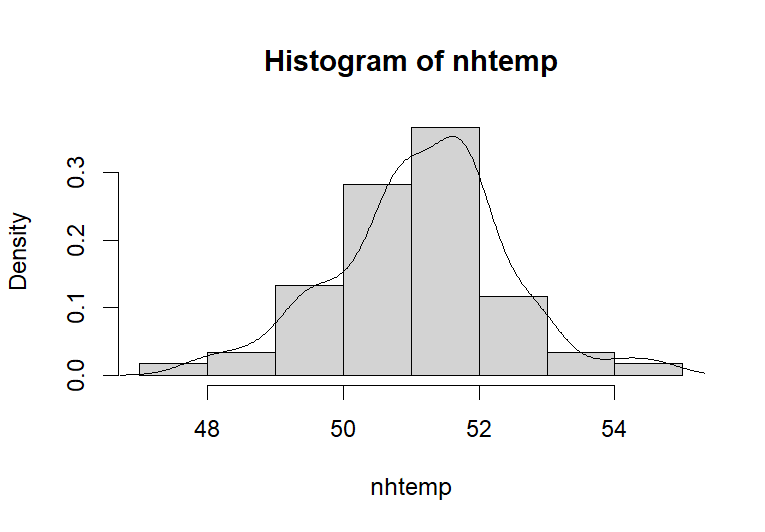
Example 1
We are going to use the New Haven temperature data to plot the histogram and the density line.
# plot the basic histogram figure
hist(nhtemp, freq =FALSE)

# add the density line on the top of the histogram
lines(density(nhtemp))
The following is the histogram with density line.
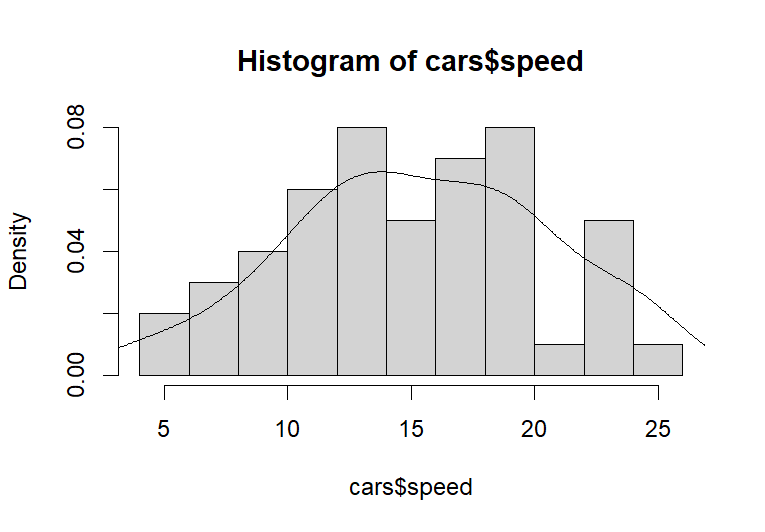
Example 2
Example 2 will use the built-in data cars to plot the histogram and density line in R.
# plot the basic histogram figure
hist(cars$speed,freq =FALSE,breaks = 10)

# add the density line on the top of the histogram
lines(density(cars$speed))
The following is the figure.