How to Increase Bin Density in Histogram in R
This tutorial shows how to increase bin density in histogram in R. You can use breaks in hist() to do so. Below is the basic R syntax of doing so.
hist(dataset_name,breaks = 50)
Example 1
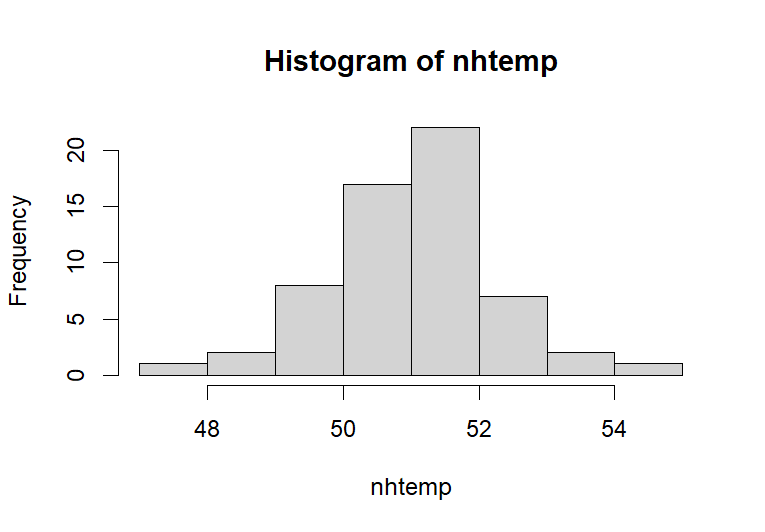
We are going to use the “Average Yearly Temperatures in New Haven” for the first example to show how to increase bin density in histogram in R.
The following is the R code of hist() without and with breaks parameter.
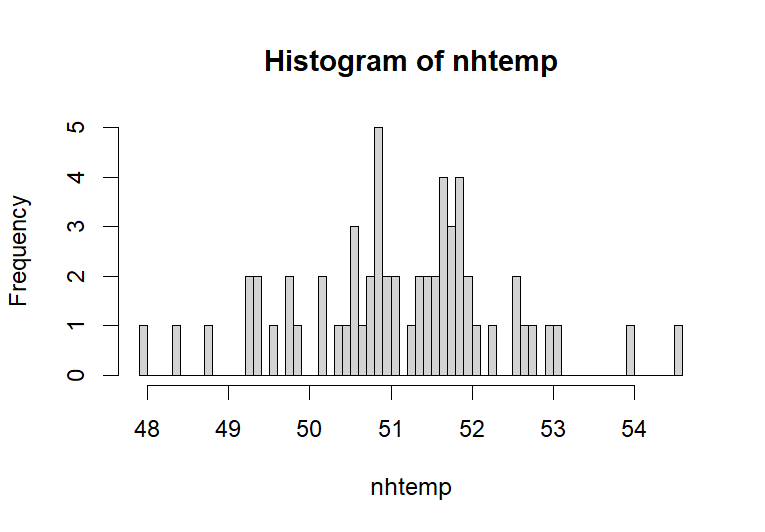
# without "breaks" parameter in hist()
hist(nhtemp)
# with "breaks" parameter in hist()
hist(nhtemp,breaks = 50)
The following histogram is the output of hist() with the “breaks” parameter.
Example 2
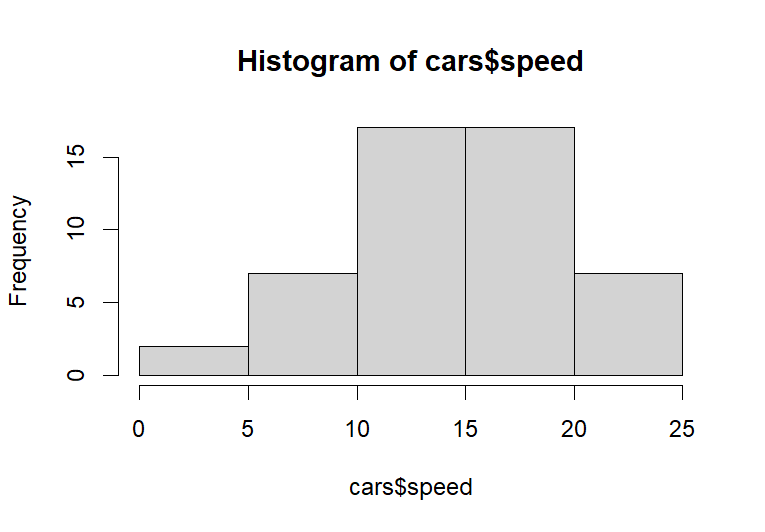
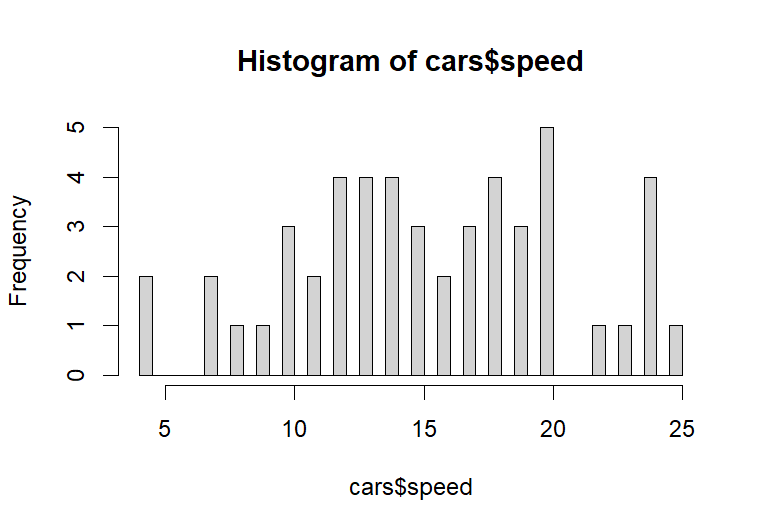
Example 2 will use the cars dataset. The following is the R code without (low bin density in histogram) and with (high bin density in histogram) the breaks parameter.
# without "breaks" parameter in hist()
hist(cars$speed)
# with "breaks" parameter in hist()
hist(cars$speed,breaks = 30)
The following are the figures.