Select Cases in SPSS
In this tutorial, we will explore how to select cases in SPSS. Based on the selected cases, this tutorial will show you how to analyze data after applying those filters. This process allows you to focus on specific groups within a dataset while excluding others from the analysis.
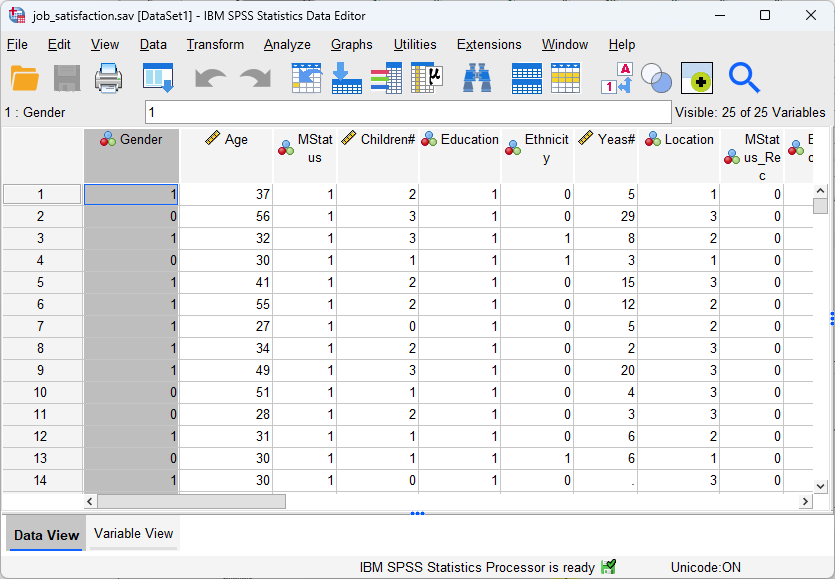
For instance, as discussed in the tutorial on Data vs. Variable Views in SPSS (click here to review it), we know that the ![]() dataset of Job Satisfaction (click here to download) has a variable of Gender: 0 represents male participants, and 1 represents female participants. In this tutorial, we are going to use this dataset to illustrate how we can select cases and then do analyses on the selected cases. For instance, one researcher might just want to focus on female participants and to conduct mean calculation and one sample t-test. To do that, it would be easier to filter out male participants in the data in SPSS first.
dataset of Job Satisfaction (click here to download) has a variable of Gender: 0 represents male participants, and 1 represents female participants. In this tutorial, we are going to use this dataset to illustrate how we can select cases and then do analyses on the selected cases. For instance, one researcher might just want to focus on female participants and to conduct mean calculation and one sample t-test. To do that, it would be easier to filter out male participants in the data in SPSS first.
1. Steps of Selecting Cases in SPSS
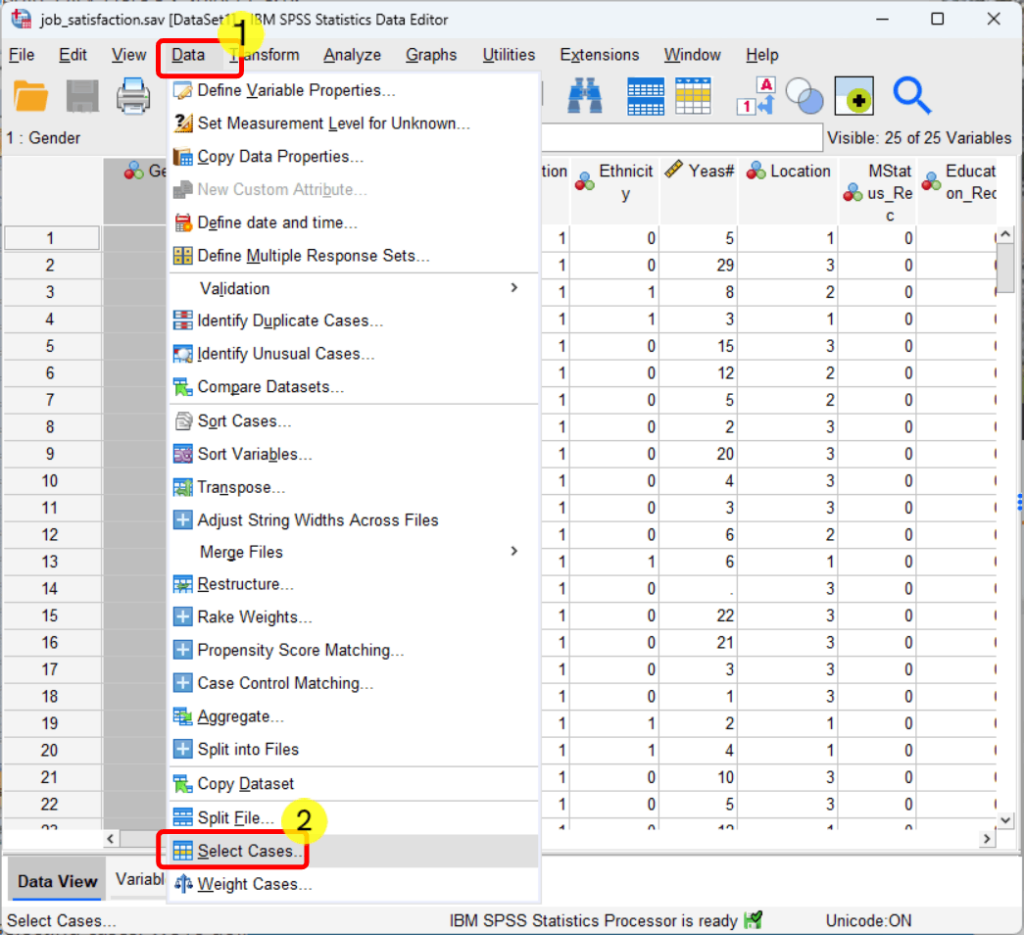
- Click Data
- Click Select Cases
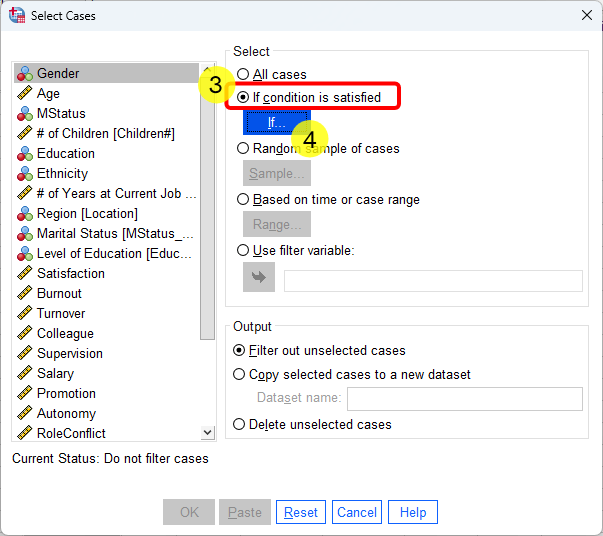
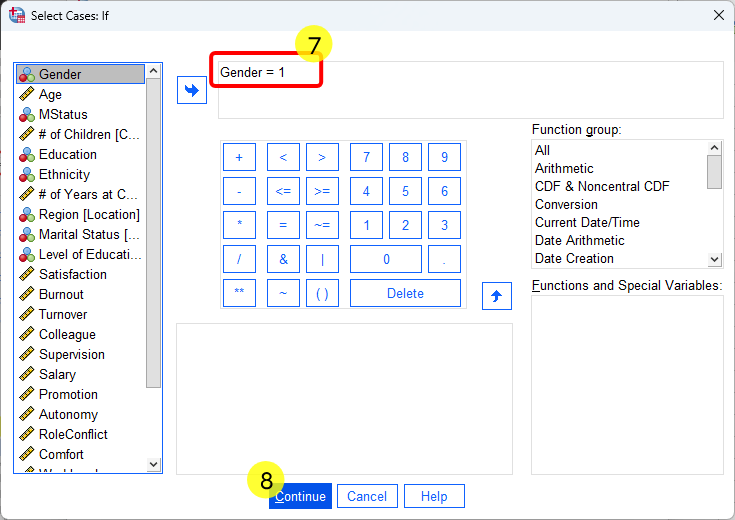
- Select “If condition is satisfied“
- Click “If” button below “If condition is satisfied“
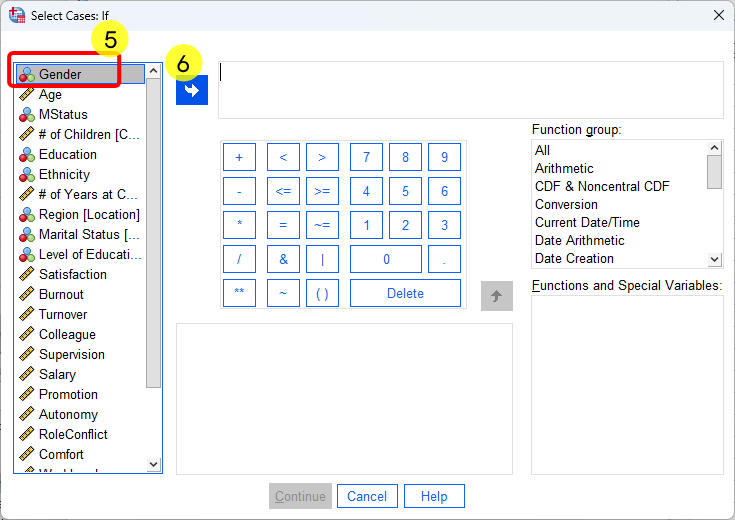
- Select Gender
- Click the Blue Arrow to move Gender to the blank box.
- After seeing Gender is in the box, type or select “=1” since we focus on female participants.
- Click Continue
- Click OK
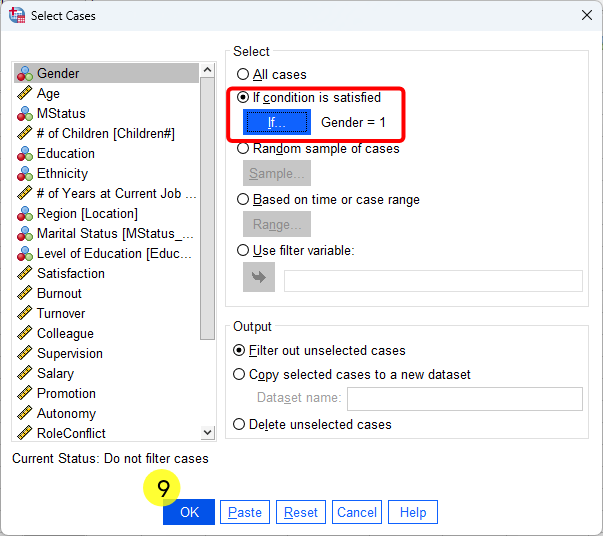
After conducting the 8 steps, we can see that SPSS marks the cases that have not been selected by crossing them out on the left side. It also automatically creates a filter variable (i.e., filter_$) indicating whether each case is included or excluded. In addition, “Filter On” appears in the bottom-right corner, signaling that all subsequent analyses will be performed only on the selected subset of data rather than the full dataset.

2. Example of Calculating Mean on Selected Cases
To calculate the women’s age, we can then calculate the mean the selected cases. As you can see, all these steps are the same as the typical steps of calculating mean in SPSS (click here to see the tutorial). This is because the Filter is automatically one, as discussed earlier the SPSS will just automatically selects the rows of fremale participants in the calculation.
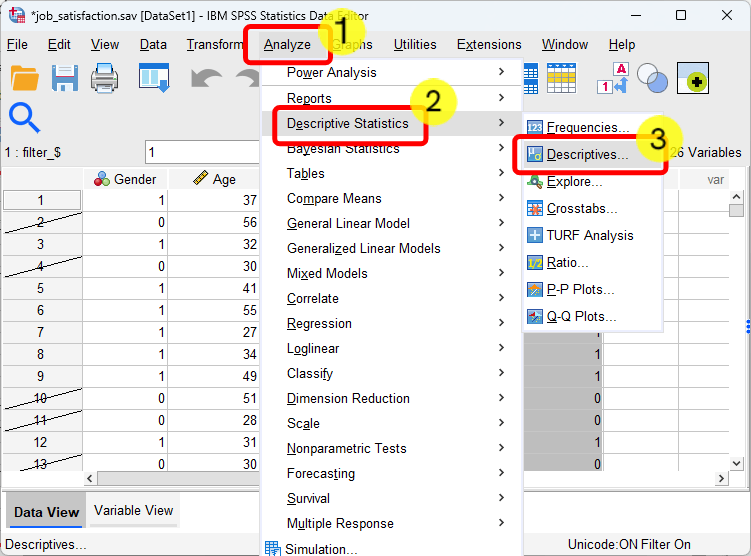
- Click Analyze.
- Select Descriptive Statistics
- Select Descriptives
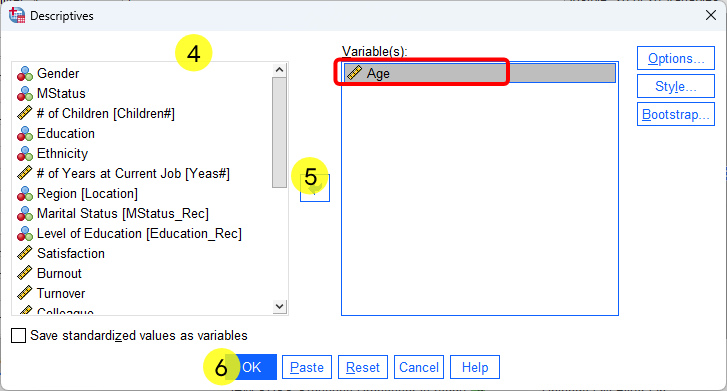
- Click Age
- Click the blue arrow button and move it into Variable(s) box.
- Click OK
After completing the six steps shown above, the output shows N = 179, indicating that there are 179 female participants with available age information in the dataset. The mean age for these participants is 36.23 years. From the previous tutorial on descriptive statistics in SPSS (click here) , we know that the dataset contains 182 female participants in total. The difference suggests that 3 female participants have missing age data. Overall, this result confirms that the age analysis was successfully conducted using only the selected female cases.

3. Example of One Sample t-test on Selected Cases
A one-sample t-test is used to compare a sample mean with a predetermined (known) value. If a researcher is specifically interested in testing whether female participants’ mean age differs from a particular value, a one-sample t-test is appropriate. Because the cases have already been selected and the filter is turned on, a regular one-sample t-test can be conducted, and SPSS will automatically include only the rows corresponding to female participants in the analysis.
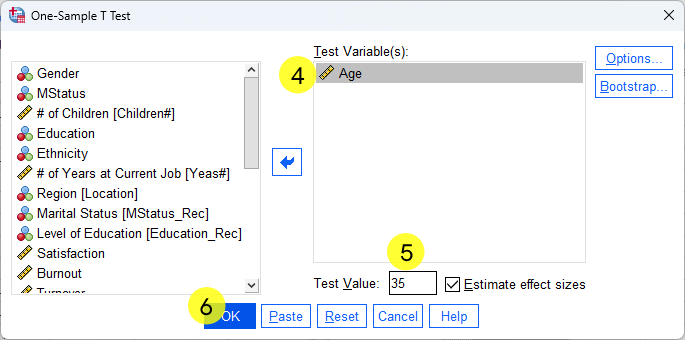
For example, if a researcher wants to examine whether the mean age of the female participant sample is significantly different from 35, a one-sample t-test can be used to evaluate this question. The null hypothesis states that the average age is not significantly different from 35, while the alternative hypothesis states that the average age is significantly different from 35.
- Click Analyze
- Click Compare Means
- Click One-sample T Test
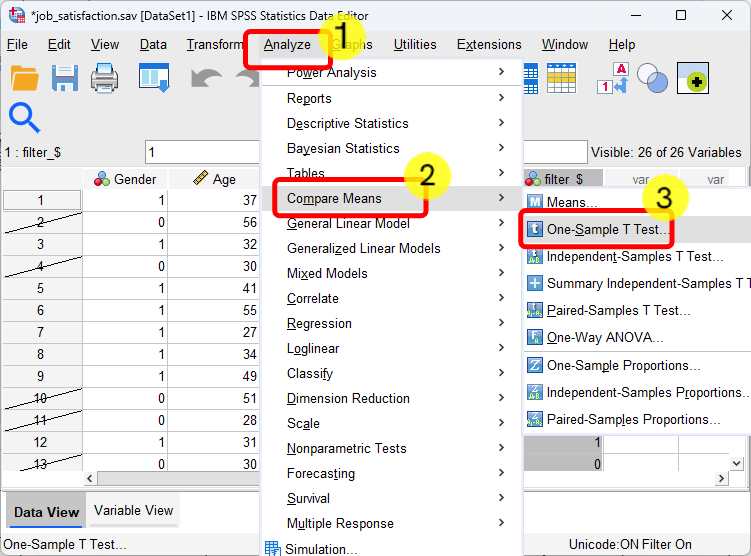
- Move Age to Test Variable(s) box
- Tyle 35
- Click OK
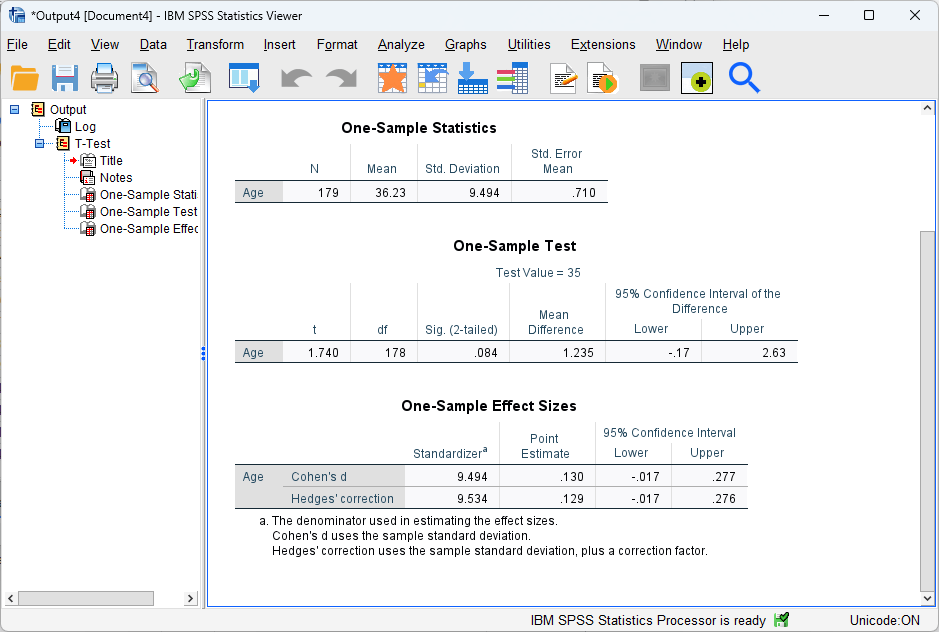
After the 6 steps in SPSS, the result was shown above. In particular, we can see that the analysis included 179 female participants, with a mean age of 36.23 years (SD = 9.49), which is consistent with our mean analysis shown earlier. Given the values of t(178) = 1.74 and p = .084 (two-tailed), we can conclude that the difference between the sample mean and the test value was not statistically significant. The 95% confidence interval for the mean difference ranged from −0.17 to 2.63, which includes zero. Thus, the confidence interval also indicates that the mean age of female participants is not significantly different from 35.
Discussion