Two sample t-test: Definition, formula, and Examples
Two sample t-test is also called independent sample t-test or unpaired sample t-test. This tutorial explains what two sample t-test is, its formula, and examples of two sample t-test.
Motivation Example
Imagine that a researcher is interested in determining whether male and female consumers have different attitudes toward drinking coffee in New York City. Because the population of New York City is very large, it is not practical to survey every individual.
One potential solution is to randomly sample 30 male and 30 female participants and then calculate the mean attitude score for each gender. Although the sample means for males and females are likely to differ, this observed difference may be due to random sampling variation. To determine whether the difference between the two sample means is statistically significant, a two-sample t-test can be used.
Definition and Example
Two sample t-test is used to test whether means from two different groups of people or objects are significantly different.
The name of two sample t-test suggests that it involves two separate, independent samples.
You test how how men and women differ in their attitudes towards drinking coffee. Here, two samples of men and women are independent from each other.
AttitudesMen vs. AttitudesWomen
Hypothesis for two sample t-test
The null hypothesis is that the underlying population means of two groups are the same:
H0:μ1=μ2
The alternative hypothesis is that the means are not equal:
H1:μ1≠μ2
Formula of two sample t-test
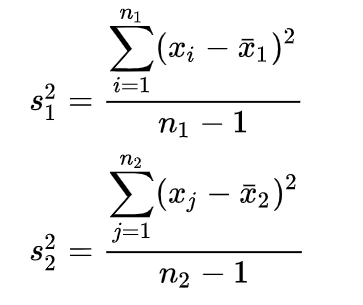
\( \bar{x_1} \) and \( \bar{x_2} \) are the sample means, and \( s_1^2 \) and \( s_2^2 \) are the sample variances.
The following are formulas for two sample t-test, including situations of equal variances and unequal variances.
When we assume the variances of group 1 and group 2 are equal:
\[ t=\frac{\bar{x_1}-\bar{x_2}}{ \sqrt{s_p^2(1/n_1+1/n_2)}} \]
Where,
\( s_p^2=\frac{((n_1-1)s_1^2)+((n_2-1)s_2^2)}{n_1+n_2-2} \)
When the variances of two groups are equal, the degree of freedom for the test statistic is df = n1+n2-2.
When we assume the variances of group 1 and group 2 are unequal:
\[ t=\frac{\bar{x_1}-\bar{x_2}}{ \sqrt{(s_1^2/n_1+s_2^2/n_2)}} \]
When the variances of two groups are unequal, the degree of freedom for the test statistic is \( df=\frac{(\frac{s_1^2}{n_1}+\frac{s_2^2}{n_2})^2}{\frac{(s_1^2/n_1)^2}{n_1-1}+\frac{(s_2^2/n_2)^2}{n_2-1}} \) . .
When n1 = n2
Note that, when n1 = n2 = n, the formula of equal variance and the formula of unequal variance are the same and they will generate the exactly same result for the t statistic. That is,
\[ t=\frac{\bar{x_1}-\bar{x_2}}{ \sqrt{ \frac{s_1^2+s_2^2}{n}}} \]
However, when n1 = n2 = n, the degree of freedom for unequal variances is still not n1+n2-2. Instead, it is \( df=\frac{(n-1)(s_1^2+s_2^2)^2}{(s_1^2)^2+(s_2^2)^2} \) .
Manual Calculation Example
Suppose you want to test whether women and men differ in their attitudes toward a brand, and the attitude is measured on a 7-point scale (1= Not like at all, 7 = Like it a lot).
The following is the hypothetical data, one column for men’s attitudes and another one for women’s attitudes toward the brand.
| Men’s Attitudes | Women’s Attitudes |
|---|---|
| 4 | 4 |
| 6 | 3 |
| 7 | 4 |
| 7 | 5 |
| 6 | 2 |
| 7 | 1 |
The following is the means for men’s and women’s attitudes.
\( \bar{x_1}=\bar{x}_{men}=\frac{4+6+7+7+6+7}{6}=6.17 \)
\( \bar{x_2}=\bar{x}_{women}=\frac{4+3+4+5+2+1}{6}=3.17 \)
After knowing the means, we can calculate the sample variances for men and women respectively.
\( s_1^2=s_{men}^2=\frac{(4-6.17)^2+(6-6.17)^2+(7-6.17)^2+(7-6.17)^2+(6-6.17)^2+(7-6.17)^2}{6-1}=1.37 \)
\( s_2^2=s_{women}^2=\frac{(4-3.17)^2+(3-3.17)^2+(4-3.17)^2+(5-3.17)^2+(2-3.17)^2+(1-3.17)^2}{6-1}=2.17 \)
Then, we can calculate the pooled variance.
\( s_p^2=\frac{((n_1-1)s_1^2)+((n_2-1)s_2^2)}{n_1+n_2-2}=\frac{(6-1)1.37+(6-1)2.17}{6+6-2}=1.77 \)
Then, we can get the t statistic.
\( t=\frac{\bar{x_1}-\bar{x_2}}{\sqrt{s_p^2(1/n_1+1/n_2)}}=\frac{6.17-3.17}{\sqrt{1.77(1/6+1/6)}}=3.90935 \)
The degree of freedom is 10 if assuming equal variances. The critical t-value for p=0.05 and df=10 is 2.228. Thus, we can reject the null hypothesis. That is, we can conclude that men and women significantly differ in their attitudes. Further, the means suggest that men have significantly more favorable attitudes than women.
Other Resources
What is the difference between independent and paired sample t-test
Discussion