What is dnorm in R (Examples)
This tutorial shows how you can use dnorm() in R with examples. The following is the syntax of dnorm().
dnorm(x, mean = 0, sd = 1, log = FALSE)
- mean: The mean of the normal distribution sample data. The default value is 0.
- sd: The standard deviation. The default value is 1.
- log: logical; if TRUE, returned log() value of the density.
How dnorm is calculated in R
dnorm() in R is to return the value of pdf function for normal distribution given parameters for x, μ, and σ.
\[ f(x)=\frac{1}{\sqrt{2 \pi \sigma^2}}e^{-\frac{1}{2}(\frac{x-\mu}{\sigma})^2} \]
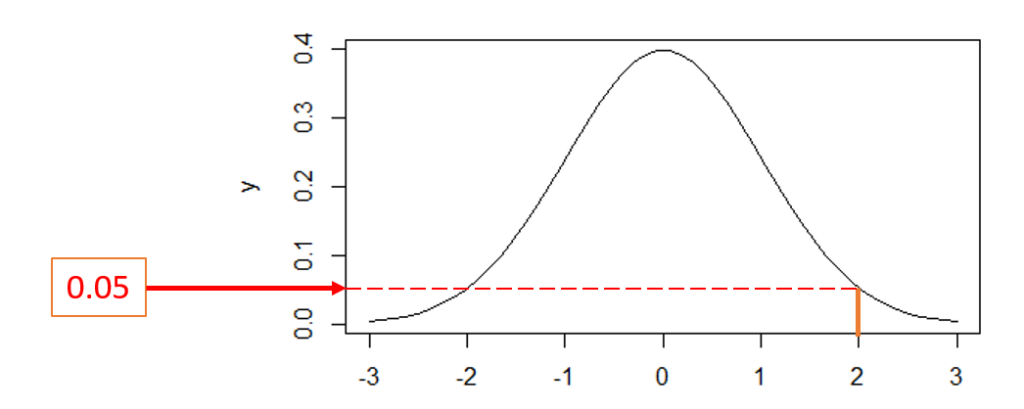
For instance, dnorm(2) will return 0.054. Visually, it is the value on Y-axis in the bell shape curve of normal distribution (see the figure below).
Examples of how to use dnorm in R
Example 1: Basic dnorm()
We can write dnorm(2) or dnorm(2, 0, 1). Both of them will return the same result of 0.054, since the default valurs for dnorm are mean = 1 and sd =1.
> dnorm(2)
[1] 0.05399097

> dnorm(2,0,1)
[1] 0.05399097
Example 2: dnorm() with log=TRUE
The following shows how to use log. When log=TRUE, it returns the log of the density value.
> dnorm(2,0,1, log=TRUE)
[1] -2.918939
We can check it by logging (0.053)
> log(dnorm(2,0,1))
[1] -2.918939
> log(0.05399097)
[1] -2.918938
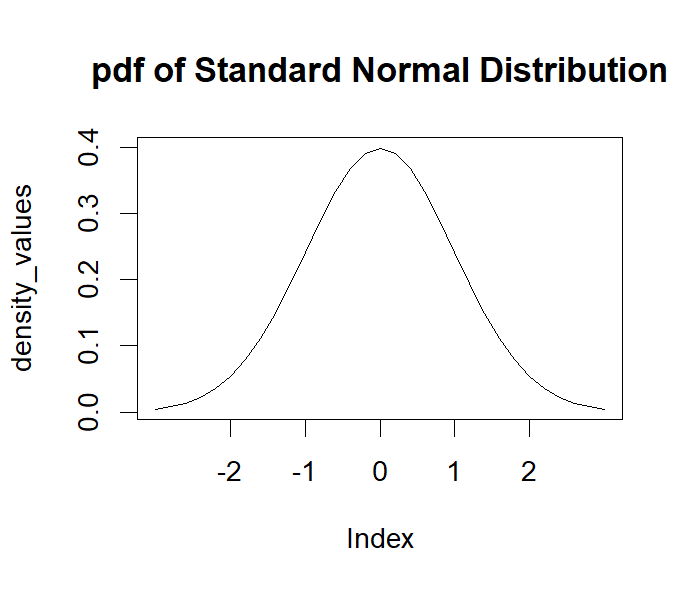
Example 3: use dnorm() to plot pdf of normal distribution
Since dnorm returns the density values of a normal distribution, we can use it to plot the pdf of the normal distribution. The following is the R code showing how to plot it.
# create a vector of X_value
X_value <- seq(-3, 3, by = .2)

# calculate their density values
density_values <- dnorm(X_value)

# plot it
plot(density_values,
     xaxt = "n",
     type = "l",
     main = "pdf of Standard Normal Distribution")

# add labels on x-axis
axis(1, at=which(density_values == dnorm(2)), labels=c(-2, 2))
axis(1, at=which(density_values == dnorm(1)), labels=c(-1, 1))
axis(1, at=which(density_values == dnorm(0)), labels=c(0))
The following is the output. It plots the pdf of the standard normal distribution.