Z-Score: Definition, Formula, and Example
1. Definition
A Z-score, also known as a standard score, measures how many standard deviations a data point is from the mean of a dataset. It is used in statistics to standardize data, compare different distributions, and detect outliers.
A positive Z-score means the data point is above the mean, while a negative Z-score indicates it is below the mean. A Z-score of 0 means the value is exactly at the mean.
2. Formula
When the mean and standard deviation of the population are known:
\( Z =\frac{X-\mu}{\sigma} \)
- \( X\) = Individual data point
- \( \mu \) = Mean of the population
- \( \sigma \) = Standard deviation of the population
When the mean and standard deviation of the population are unknown and you need to estimate them from a sample:
\( Z =\frac{X-\bar{X}}{S} \)
- \(X\) = Individual data point
- \(\bar{X} \) = Mean of the sample
- \( S\) (Sample standard deviation)=\( \sqrt{\frac{\sum (x_i-\bar{X})^2 }{n-1}}\)
3. Example
Suppose the average score in a population on a math test is 70. You also know that the population standard deviation is 10. If a student scores 85, their Z-score is calculated as follows:
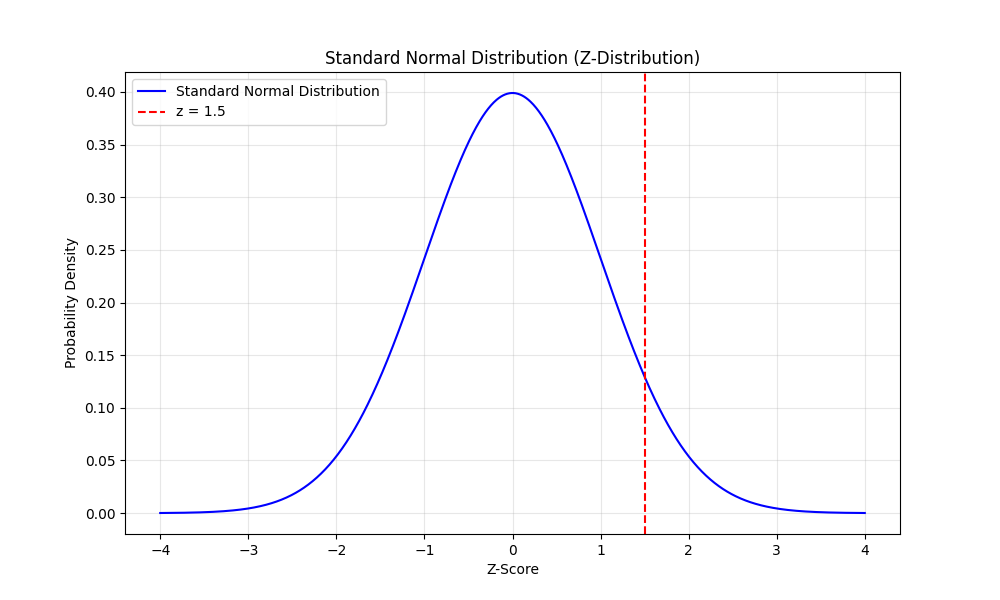
\( Z = \frac{X-\mu}{\sigma} = \frac{85 – 70}{10} = \frac{15}{10} = 1.5\)
This means the student’s score is 1.5 standard deviations above the mean. You can see the visual represation of \( z = 1.5 \) on the following plot.
4. Applications of Z-Scores
- Standardization:
Converts different datasets to a common scale for comparison. - Outlier Detection:
Data points with very high or low Z-scores (e.g., beyond ±3) may be considered outliers. - Probability & Normal Distribution:
Helps determine how likely a value is in a normal distribution using Z-tables. You can refer to this page on Z-table, which also includes examples of how to test probability using Z-table.
Discussion