How to Interpret the Interaction Between Two Continuous Variables
This tutorial is about how to interpret the interaction between two continuous independent variables in a regression model.
In this example, the dependent variable is Mileage per gallon (MPG), and the independent variables are car weight (WT), horsepower (HP) and their interaction, namely HP*WT. You can download the dataset via Github ![]() the dataset of MPG.
the dataset of MPG.
 .
. After running the linear regression in SPSS or other software, we can get the following output.
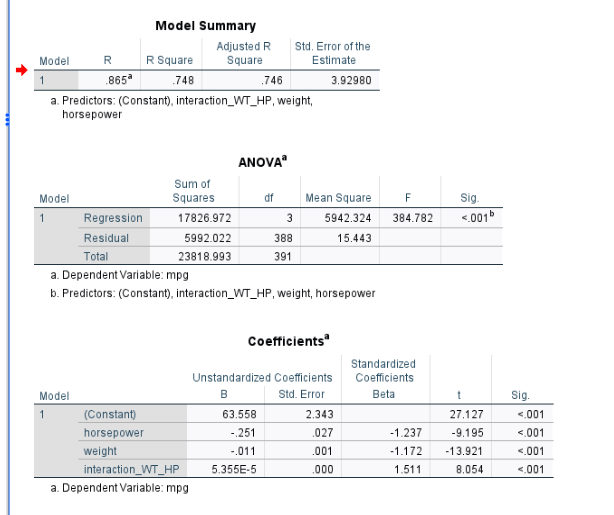
As we can see from the output shown above, the interaction item is significant (p-value < 0.05). Thus, based on the output, we can write out the following model.
MPG=63.56 -0.01WT- 0.25HP + 0.00005 HP*WT
1. Plot the Interaction
A significant interaction means that the effect of one variable depends on the value of the other. To properly interpret this interaction, we need to visualize it.
To plot and interpret the interaction between two continuous variables, a common approach is to use values at −1 standard deviation (low) and +1 standard deviation (high) for each independent variable.
Step 1: Compute Descriptive Statistics
First, calculate the mean and standard deviation for weight (WT) and horsepower (HP).
| Mean | SD | |
|---|---|---|
| WT | 2970 | 847 |
| HP | 104 | 38 |
Using the mean and standard deviation, compute:
- High horsepower (mean + 1 SD)
- Low weight (mean − 1 SD)
- High weight (mean + 1 SD)
- Low horsepower (mean − 1 SD)
| -1SD | +1SD | |
|---|---|---|
| WT | 2970-847 = 2124 | 2970+847 = 3817 |
| HP | 104 – 38 = 66 | 104 + 38 = 143 |
Step 2: Estimating MPG Values
Next, plug each of the four combinations into the regression equation. This produces four predicted MPG values, which can be arranged in a 2 × 2 table:
- Light weight & low horsepower
- Light weight & high horsepower
- Heavy weight & low horsepower
- Heavy weight & high horsepower
| – 1 SD of WT | + 1 SD of WT | |
|---|---|---|
| -1SD HP | 32 | 19 |
| +1SD HP | 21 | 16 |
These predicted values represent the expected MPG under each condition. Based on these 4 expected MPG value, we can plot the interaction figure (see below).
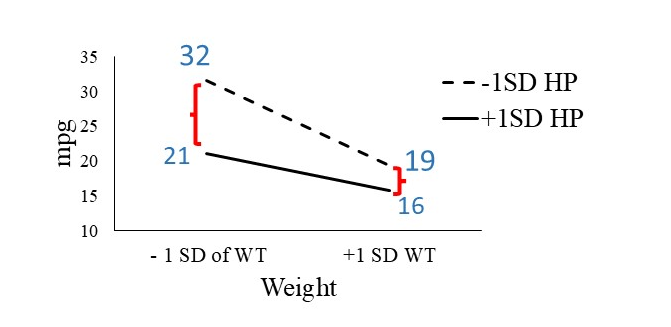
2. Interpreting the Interaction Plot
2.1. Main Effect of Weight
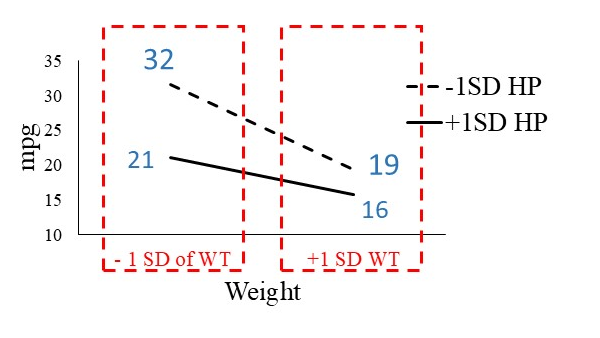
Comparing lighter and heavier cars:
- Heavier cars have lower MPG
- Lighter cars have higher MPG
This is evident because the MPG values for heavier cars are consistently lower than those for lighter cars. This finding aligns with common expectations.
2.2. Main Effect of Horsepower
Comparing horsepower levels:
- Cars with lower horsepower have higher MPG
- Cars with higher horsepower have lower MPG
In the interaction plot, the dashed line (low horsepower) lies above the solid line (high horsepower), indicating better fuel efficiency for lower-horsepower vehicles.
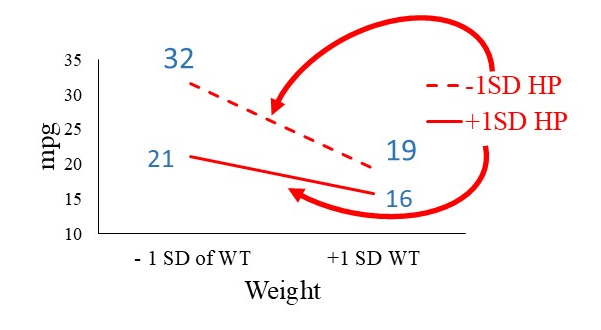
2.3. Interaction Between Weight and Horsepower
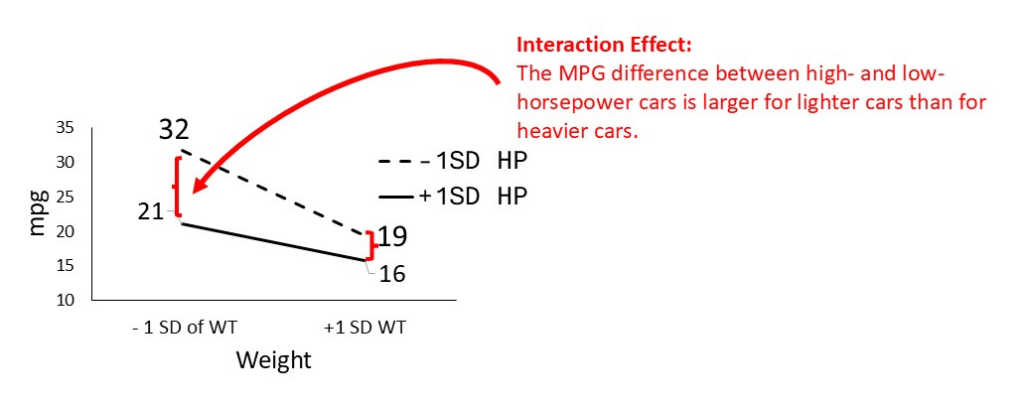
The interaction becomes clear when we examine the slopes of the lines:
- The dashed line (low horsepower) is steeper than the solid line (high horsepower)
What does this mean?
- The difference in MPG between low and high horsepower cars is larger for lighter cars
- For heavier cars, the MPG difference between low and high horsepower is smaller
In other words:
The negative impact of higher horsepower on MPG is more pronounced in lighter cars than in heavier cars.
This difference in slopes is the key evidence of an interaction effect.
The following is video version of the tutorial:
Discussion