One Variable Chi-Square in SPSS
This tutorial shows how you can do one variable chi-square in SPSS with detailed examples. The following shows two examples, one using Syntax and one using a menu interface.
Examples of One Variable Chi-Square in SPSS
Example 1
A school is offering 3 courses, and you would like to see whether the number of students enrolled in each course is equal across these 3 courses.
In this example, the grouping variable is Course, which has 3 categories, namely 3 different courses. The following is the example data.
| Course Names | Student Counts |
|---|---|
| Math | 25 |
| Computer | 50 |
| English | 30 |
We can use SPSS syntax to test this one variable chi-square. The following is the syntax.
DATA LIST LIST / a count.
BEGIN DATA.
1 25
2 50
3 30
END DATA.
WEIGHT BY count.
NPAR TESTS
/CHISQUARE=a.
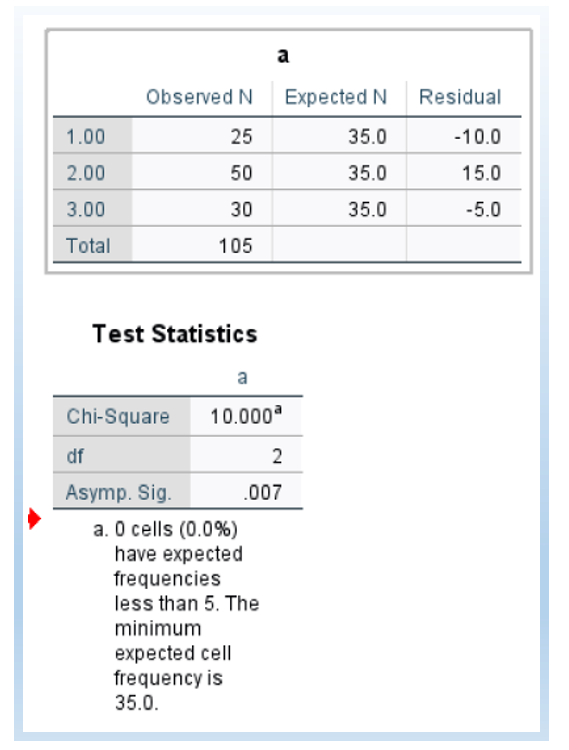
The following is the output. We can see that the chi-square value is χ2 =10, df = 2, and p-value = 0.007. Thus, we can conclude that at least one course has an enrollment number that is different from the average enrollment number.
Example 2
Different from Example 1, Example 2 will use an SAV data file, and you can download the ![]() SPSS SAV file here. This dataset has been used in some other tutorials online, see UCLA website and another website.
SPSS SAV file here. This dataset has been used in some other tutorials online, see UCLA website and another website.

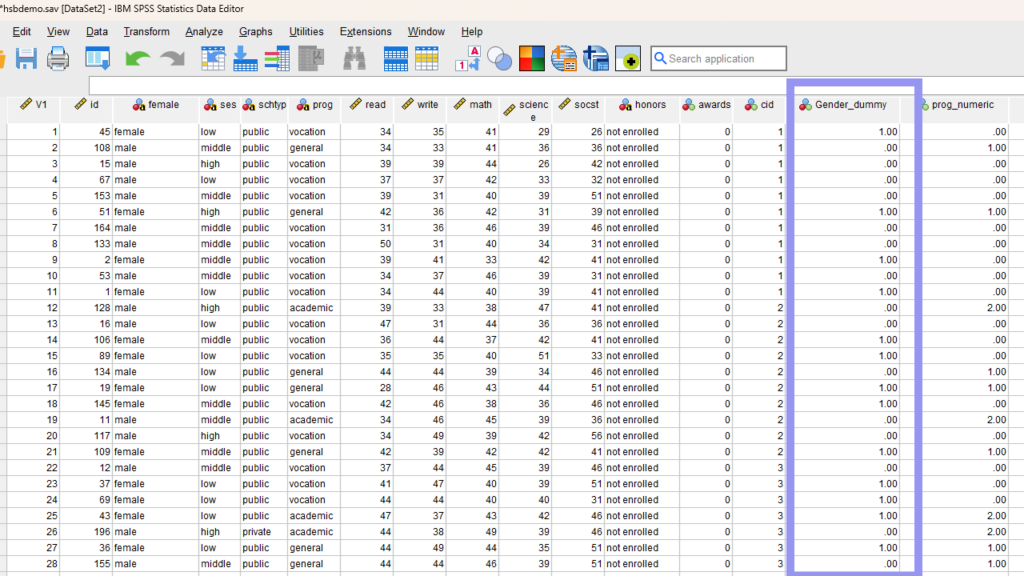
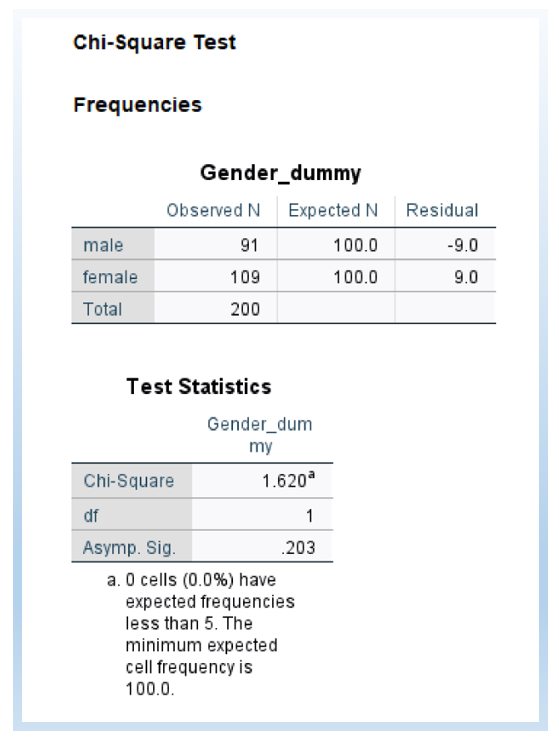
We are going to test whether male and female student numbers are the same. Different from Example 1 (which has counted numbers already, namely a contingency table), Example 2 will have a whole column of data (i.e., each row is a participant). That is, each row of data represents one student. The following is the screenshot of the dataset, and the column name is Gender_dummy, 1 = female and 0 = male.
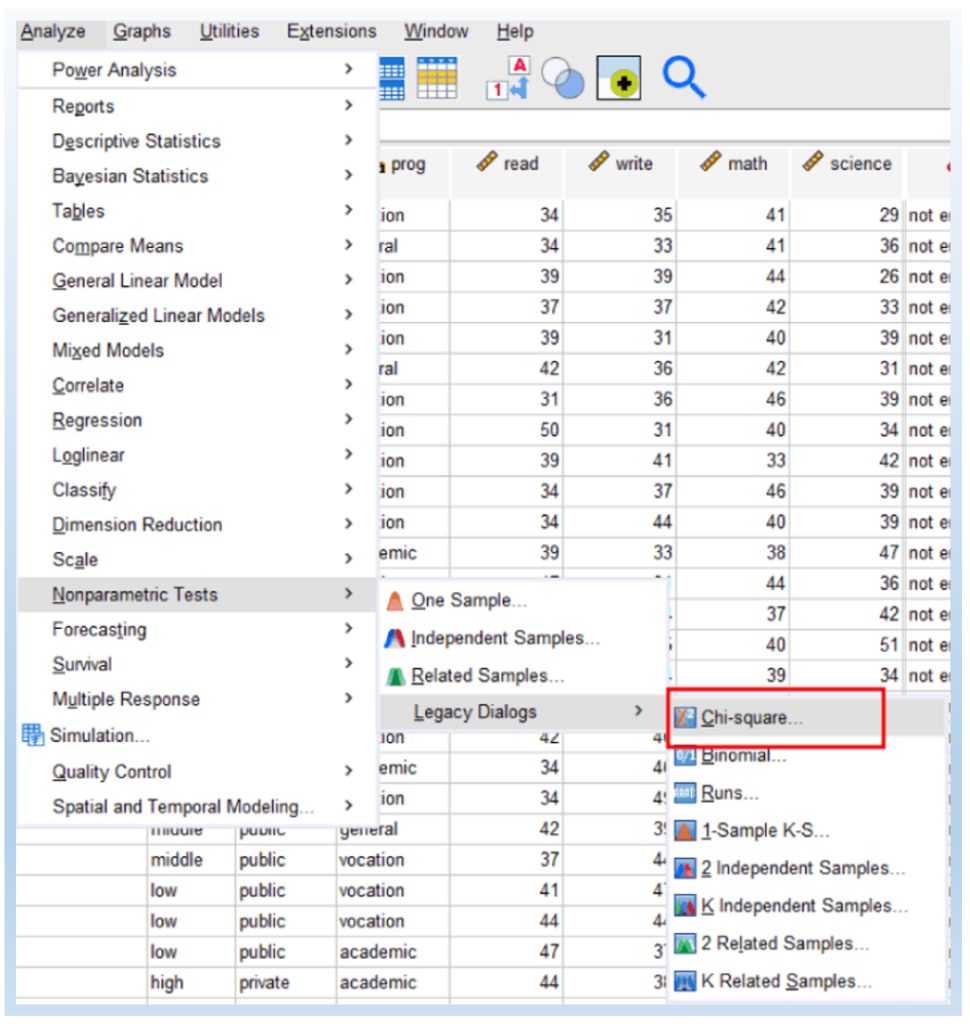
- First step: Click Analyze > Nonparametric Tests > Legacy Dialogs > Chi-square, as shown below.
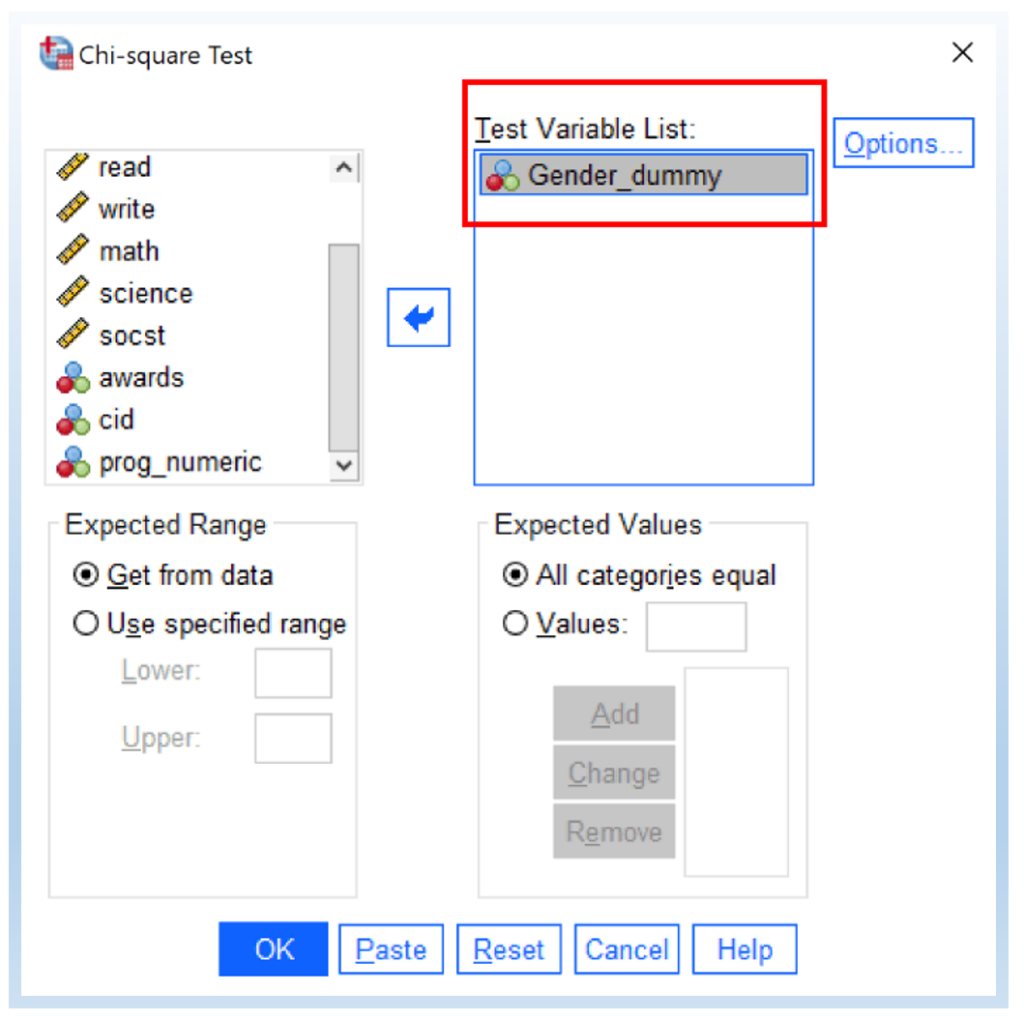
- Second step: Add Gender_dummy to Test Variable List and then click OK.
The following is the output. As we can see that χ2 =1.620, df = 1, and p-value = 0.203. Since the p-value is greater than 0.05, we fail to reject the null hypothesis. Thus, we conclude that the number of male and female student numbers do not significantly differ.
Additional Discussion
If you run the descriptive statistics – frequency analysis in SPSS for the Gender_dummy variable (click here to see how to conduct that in SPSS) and know the frequency counts for male and female students. You can also conduct the one-variable chi-square in SPSS using the following syntax. You will get the same result as the menu method shown above.
DATA LIST LIST / a count.
BEGIN DATA.
1 91
2 109
END DATA.
WEIGHT BY count.
NPAR TESTS
/CHISQUARE=a.