Correlation: Definition, Formula, and Examples
1. What is Correlation?
Correlation is a statistical measure of the relationship between two variables, X and Y. For instance, you can measure to what extent temperature (X) is related to the production of ice cream (Y). You probably would expect that higher temperatures correspond with higher production of ice cream.
2. Conceptual Framework of Correlation
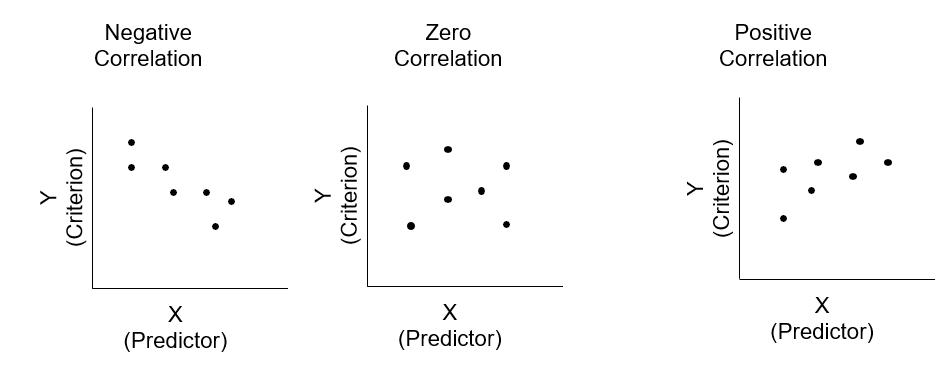
Conceptually, there are three types of correlation, namely negative, zero, positive correlations. For negative correlation, it means that X going up corresponds with Y going down (or, vice versa). In contrast, the positive correlation of X and Y means that if X going up, Y will move up. For zero correlation, it means that X and Y do not correspond with each other.
Correlation coefficients are in the range between -1 and +1. The following table summarizes the implication of different values of correlation coefficients. Note that, we need to view the strength of a correlation based on the absolute value, rather than positive or negative signs. Explained Variance measures the proportion to which X accounts for the variation (dispersion) of Y. For instance, +0.6 implies that X explains for 36% variance of Y.
| Coefficient | -1 | -0.6 | -0.3 | 0 | +0.3 | +0.6 | +1.0 |
|---|---|---|---|---|---|---|---|
| Direction | Negative | Negative | Negative | Nonexistent | Positive | Positive | Positive |
| Strength | Strong | Medium | Weak | Absent | Weak | Medium | Strong |
| Explained Variance | 100% | 36% | 9% | 0 | 9% | 36% | 100% |
3. Correlation Formula and Manual Calculation
The following is the formula for correlation. Let’s use a hypothetical example and dataset to show how to use this formula manually.
\[r_{xy}=\frac{\sum_{i=1}^{n}((x_i-\bar{x})(y_i-\bar{y}))}{\sqrt{\sum_{i=1}^{n}(x_i-\bar{x})^2}\sqrt{\sum_{i=1}^{n}(y_i-\bar{y})^2}}\]
| Temperature | Iced coffee sales |
|---|---|
| 34 | 41 |
| 36 | 40 |
| 40 | 50 |
| 60 | 150 |
| 40 | 100 |
| 75 | 200 |
We first calculate the means of both temperature and Iced coffee sales.
$$\bar{x}=\frac{34+36+40+60+40+75}{6}=47.5$$
$$\bar{y}=\frac{41+40+50+150+100+200}{6}=96.83$$
Then, we can use the means to write down the specific calculation based on the correlation formula.
$$\sum_{i=1}^{n}((x_i-\bar{x})(y_i-\bar{y})) = (34-47.5)\times (41-96.83) + (36-47.5) \times (40-96.83) \\ + (40-47.5) \times (40-96.83) + (60-47.5) \times (150-96.83) + \\ (40-47.5) \times (100 -96.83) + (75-47.5) \times (200-96.83) = 5236.5 $$
$$\sum_{i=1}^{n}(x_i-\bar{x})^2=(34-47.5)^2+(36-47.5)^2+(40-47.5)^2 \\+(60-47.5)^2+(40-47.5)^2+(75-47.5)^2=1339.5$$
$$\sum_{i=1}^{n}(y_i-\bar{y})^2=(41-96.83)^2+(40-96.83)^2+(50-96.83)^2 \\+(150-96.83)^2+(100-96.83)^2+(200-96.83)^2=22020.83$$
$$r_{xy}=\frac{\sum_{i=1}^{n}((x_i-\bar{x})(y_i-\bar{y}))}{\sqrt{\sum_{i=1}^{n}(x_i-\bar{x})^2}\sqrt{\sum_{i=1}^{n}(y_i-\bar{y})^2}}=\frac{5236.5}{\sqrt{1339.5 \times 22020.83}}=0.96 $$