Difference between Interval and Ratio Data
The main difference between interval and ratio data lies in the presence or absence of a meaningful zero point and the nature of the numerical values.
Interval Data
Interval data is a type of quantitative data where the intervals between values are equal and consistent. It has a numerical scale that represents the magnitude of the variable, but it lacks a meaningful zero point. In interval data, zero does not indicate the absence of the attribute being measured but rather serves as an arbitrary reference point.
An example of interval data is temperature measured in degrees Celsius or Fahrenheit. Let’s consider the temperature in degrees Celsius as our example. In this case, the numerical values represent the magnitude of the variable (temperature) on a numerical scale. The intervals between each degree are equal and consistent, with one degree Celsius representing the same temperature difference throughout the scale.
For instance, let’s say we have the following temperature readings:
- Monday: 20 degrees Celsius
- Tuesday: 22 degrees Celsius
- Wednesday: 25 degrees Celsius
- Thursday: 18 degrees Celsius
In interval data, we can perform mathematical operations, such as addition and subtraction, to calculate differences between values or determine changes over time. For example, we can calculate that the temperature increased by 2 degrees Celsius from Monday to Tuesday and decreased by 7 degrees Celsius from Wednesday to Thursday.
It’s important to note that while we can perform arithmetic calculations on interval data, the zero point (0 degrees Celsius) does not represent a complete absence of temperature but rather an arbitrary reference point. We cannot make meaningful statements about ratios or proportions based on interval data, such as saying that 40 degrees Celsius is twice as hot as 20 degrees Celsius.
Ratio Data
Ratio data, on the other hand, is also quantitative data that possesses equal intervals between values, like interval data. However, ratio data has an additional characteristic: it includes a meaningful zero point that represents the absence or complete lack of the measured attribute. The zero point in ratio data reflects a true absence or absence at the most fundamental level. Examples of ratio data include weight, age and income, time duration, or counts of objects.
| Variable Names for Ratio Data | Numbers of Ratio Data |
|---|---|
| Weight | 70, 50, 90, … |
| Age | 18, 19, 22, 89… |
| Income | 10,000, 30,000, ….. |
For weights, it can be measured in kilograms or pounds. Let’s consider weight measured in kilograms as our example. For instance, let’s consider the weight of individuals:
- Person A: 70 kilograms
- Person B: 50 kilograms
- Person C: 90 kilograms
In ratio data, we can perform various mathematical operations, including addition, subtraction, multiplication, and division, on the numerical values. For example, we can calculate that Person C weighs 20 kilograms more than Person A and that Person B weighs half as much as Person C.
The presence of a meaningful zero point in ratio data allows for the calculation of meaningful ratios and proportions. For instance, if Person A weighs 0 kilograms, it indicates a complete absence of weight or being weightless. We can then make statements such as Person C weighing twice as much as Person A.
Other examples of ratio data include height, time duration, counts of objects, and income. In all these cases, the data possess equal intervals, a meaningful zero point, and allow for meaningful ratios and proportions.
Difference between Interval and Ratio Data
The key distinction between interval and ratio data is the presence of a meaningful zero point. In ratio data, zero indicates a complete absence, while in interval data, zero is an arbitrary reference point. This distinction has implications for the interpretation and analysis of the data.
With ratio data, meaningful ratios can be calculated. For example, if one person’s weight is twice that of another person, it can be interpreted as one person being twice as heavy. In interval data, ratios are not meaningful because the zero point is arbitrary. For instance, a temperature of 20 degrees Celsius is not twice as hot as 10 degrees Celsius.
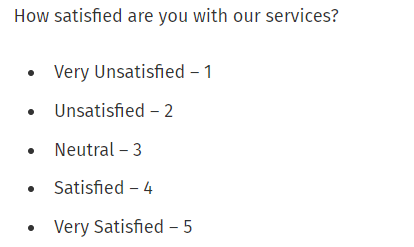
Another example of ratio data is income. Income numbers typically are ratio data because when hearing 0 income, you can understand that person earns no money. However, 0 on interval data (e.g., Likert scale) is not self-explanatory, as the scale anchors can be different. For instance, a scale can be 1, 2, 3, 4, 5 but it can be also -2, -1, 0, 1, 2. As we can see, 0 has different means, depending on the anchors. (You can read my another tutorial about if you should consider Likert scales as interval data.)
In summary, while both interval and ratio data possess equal intervals, the presence or absence of a meaningful zero point distinguishes them. Ratio data includes a true zero point, allowing for meaningful ratios, while interval data uses an arbitrary zero point and lacks meaningful ratios.