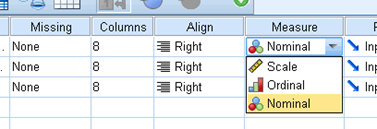
SPSS Measure: Nominal, Ordinal, and Scale
This tutorial provides definitions and examples for the 3 SPSS measures, including nominal, ordinal, and scale.
1. Definitions for Nominal, Ordinal, and Scale
Nominal Data
Variables at the nominal level are categorical and have no inherent order or numerical meaning.
Examples include gender (e.g., male or female), ethnicity (e.g., Asian, African American, Caucasian), or marital status (e.g., married, single, divorced). In SPSS, you can code nominal variables using numerical values or assign labels to each category.
Ordinal Data
Variables at the ordinal level have categories with a meaningful order or ranking but do not necessarily have equal intervals between them.
Examples include Likert scale items (e.g., strongly disagree, disagree, neutral, agree, strongly agree) or educational attainment (e.g., high school, bachelor’s degree, master’s degree, PhD). In SPSS, you can assign numerical values to ordinal categories to represent their relative order.
Scale Data
Variables at the scale level have numerical values that have equal intervals between them, and they have a meaningful zero point. Scale variables are quantitative and allow for arithmetic operations such as addition and subtraction.
Examples include age (e.g., 18, 19, 22, 89…) and income (e.g.,10,000, 30,000, …..). In SPSS, you can treat scale variables as continuous measurements and perform various statistical analyses on them.
Of note, we can calculate means for scale data. In contrast, you can not calculate means for nominal or ordinal measures.
| Normial | Ordinal | Scale | |
|---|---|---|---|
| Data Type | Qualitative | Qualitative | Quantitative |
| Category | Each category has no inherent order or numerical meaning | Categories have meaningful order or rank to them | N.A. |
| Can you calculate the mean of the data? | No | No (most situations) | Yes |
| Does 0 (i.e., number of zero) have a meaningful interpretation if it is present in the data? | No | No | Yes for ratio data but no for interval data (Refer to the discussion below: Difference between Scale, Interval, and Ratio) |
| Example | Gender (e.g., male or female), Ethnicity (e.g., Asian, African American, Caucasian), Marital status (e.g., married, single, divorced) | Educational attainment (e.g., high school, bachelor’s degree, master’s degree, PhD), Likert scale items (e.g., strongly disagree, disagree, neutral, agree, strongly agree) | Age (e.g., 18, 19, 22, 89…), Income (e.g.,10,000, 30,000, …..), Weight (e.g., 125, 127, …168) |
Pratice Questions – Part 1
- Which of the following variables is an example of ordinal data?
A. Gender (male, female)
B. Income (e.g., $30,000, $50,000)
C. Age (e.g., 18, 25, 40)
D. Educational attainment (high school, bachelor’s, master’s, PhD) - Which of the following variables is an example of norminal data?
A. Gender (male, female)
B. Income (e.g., $30,000, $50,000)
C. Age (e.g., 18, 25, 40)
D. Educational attainment (high school, bachelor’s, master’s, PhD) - Which of the following variables is not measured on a scale (interval or ratio)?
A. Temperature measured in Celsius
B. Annual income
C. Number of children in a household
D. Type of car owned
Answers: 1. D; 2. A; 3. D.
2. Difference between Nominal and Ordinal Data
The similarity between nominal and ordinal data is that they are categorical variables, and thus it does not make sense to calculate means for either of them.
For instance, you can code male =1 and female =0, but you still should not calculate the mean for the variable of gender. Similarly, you will not calculate means for the ordinal variables either.
The key difference between nominal and ordinal data is that nominal data has no inherent order, whereas ordinal data is organized in a meaningful sequence.
For example, educational attainment (e.g., high school, bachelor’s degree, master’s degree, PhD) is ordinal because the categories follow a logical order based on education level. In contrast, a nominal variable like gender (e.g., male, female) has categories without any specific order.
3. Difference between Scale, Interval, and Ratio
Scale in SPSS can be used for either interval or ratio data. Thus, SPSS does not distinguish between interval and ratio data.
The following explain the difference between interval data and ratio data.
Interval Data
Interval data is a type of quantitative data that has a numerical scale with equal intervals between values. In interval data, the numerical values represent the magnitude of the variable, and the intervals between values are consistent and measurable.
An essential characteristic of interval data is that it does not have a meaningful zero point. Zero in interval data does not indicate the absence of the measured attribute but serves as a reference point. For example, temperature measured in degrees Celsius or Fahrenheit is considered interval data. In this case, zero degrees does not mean the complete absence of temperature but serves as an arbitrary reference point.
With interval data, you can perform various mathematical operations, such as addition and subtraction. Additionally, you can calculate measures like means, standard deviations, and perform statistical tests like t-test or analysis of variance (ANOVA).
Ratio Data
Common examples of ratio data include weight, height, and income. Different from ratio data, ratio data not only has equal intervals but also possesses a meaningful zero point. The key characteristic of ratio data is that zero represents the absence or complete lack of the measured attribute.
In ratio data, the numerical values not only represent the magnitude of the variable but also allow for meaningful ratios and comparisons between values. Ratios between values are meaningful and can be calculated. For example, if you have variables such as weight, height, or income measured in a specific unit, you can perform arithmetic operations such as addition, subtraction, multiplication, and division.
With ratio data, you can calculate various descriptive statistics, such as means, medians, ranges, standard deviations, and percentages. Additionally, you can perform a wide range of statistical analyses, including correlation analysis, regression analysis, and inferential tests like t-test and ANOVA.
It’s worth noting that ratio data is considered the highest level of measurement, providing the most precise and informative data for analysis.
Practice Questions – Part 2
- Which of the following best describes nominal data?
A. Data with equal intervals and a meaningful zero
B. Data with categories that have a meaningful order
C. Data that are categorical with no inherent order
D. Data that allow for arithmetic operations - What is the key difference between nominal and ordinal data?
A. Ordinal data are quantitative, nominal data are qualitative
B. Nominal data have a meaningful zero, ordinal data do not
C. Ordinal data have a meaningful order, nominal data do not
D. Nominal data allow means to be calculated, ordinal data do not - Which statement about Likert-scale items is most accurate?
A. They are nominal and never summarized with means
B. They are ordinal, but means are often calculated in practice
C. They are ratio data with a meaningful zero
D. They cannot be used in statistical analysis - Which of the following best describes interval data?
A. Data with categories that have no order
B. Data with equal intervals and a meaningful zero
C. Data with equal intervals but no meaningful zero
D. Data that only allow ranking
Answers: 1. C; 2. C; 3. B; 4. C.
In short, Likert scales occupy a somewhat unique position in measurement theory. I address it in detail in my discussion Are Likert Scales Ordinal or Interval Data? As a side note, because of this special case, I indicated “No (most situations)” rather than a simple “No” in the table above for the question of whether the mean can be calculated for ordinal data.
Reference
The following shows the reference that you can read further.