Introduction to SPSS: A Step-by-Step Tutorial for Beginners
This tutorial provides an introduction to using SPSS for basic data analysis. You will learn how to navigate the SPSS interface and perform simple descriptive and inferential analyses using an example dataset. The goal is to help beginners become familiar with key SPSS functions through hands-on practice.
Dataset Download Link: Job Satisfaction data from Soleman H. Abu-Bader
1. Data View vs. Variable View
When you first open SPSS and load a dataset, you will see the Data View window.
Data View
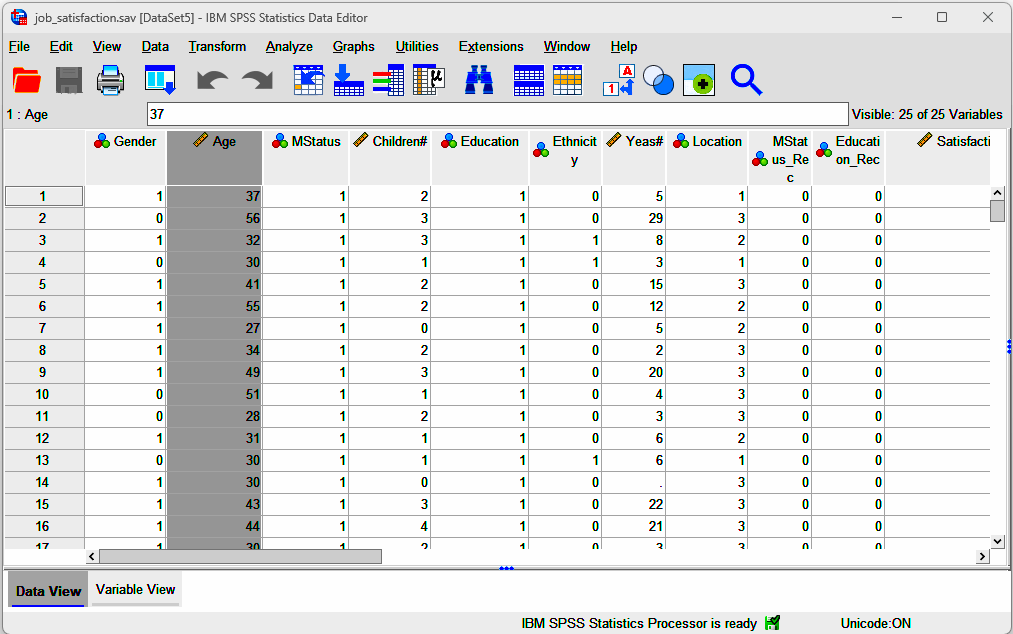
- Each column represents a variable (e.g., gender, age, marital status).
- Each row represents a participant or case.
- In the example dataset, there are 218 participants, each represented by one row.
You may notice that some variables are coded numerically (e.g., gender coded as 0 and 1). To understand what these numbers mean, you need to switch to Variable View.
Variable View
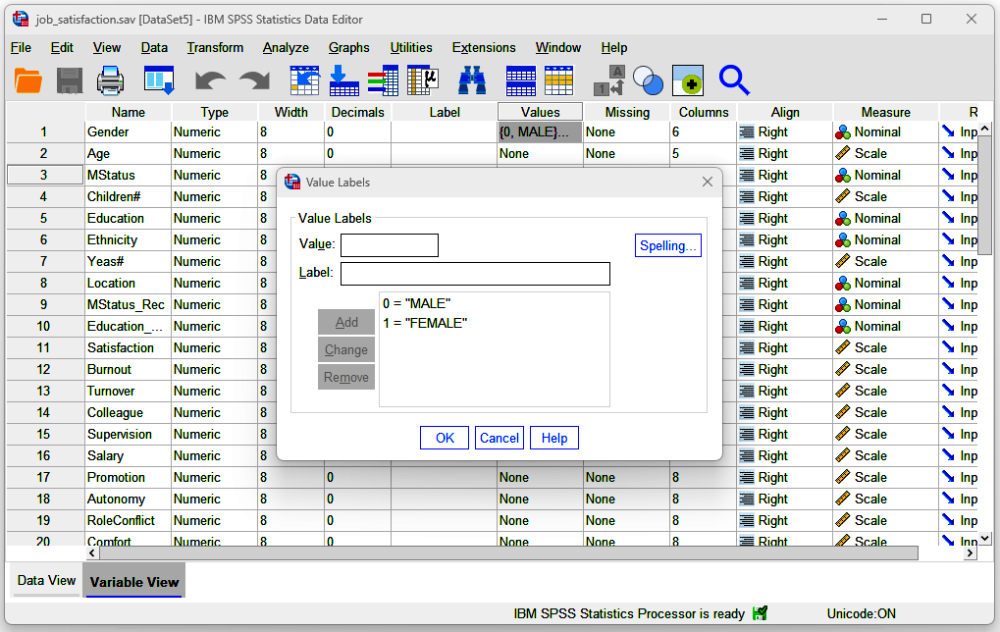
- Variable View provides information about how each variable is defined.
- Under the Values column, you can see value labels.
- For example:
- Gender:
0 = Male,1 = Female - Marital Status:
1 = Married,2 = Single,3 = Divorced
- Gender:
- For example:
- This view helps you interpret the numerical codes shown in Data View.
2. Descriptive Statistics Example 1: Frequency Analysis for Gender
Goal
Determine how many participants are male and female.
Steps
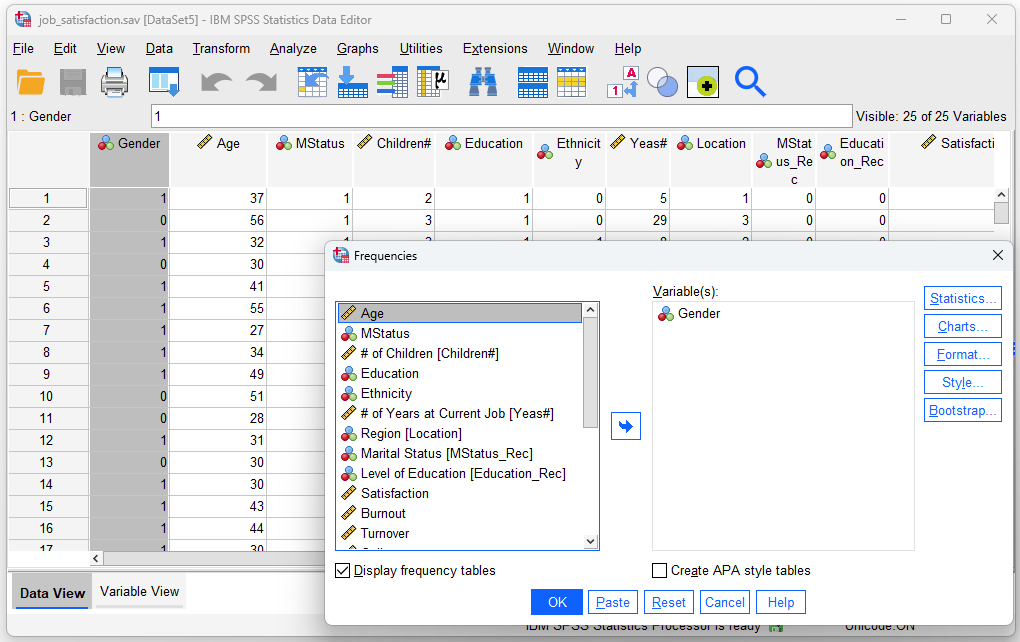
- Click Analyze in the top menu.
- Select Descriptive Statistics → Frequencies.
- Move the Gender variable into the analysis box.
- Click OK.
Output Interpretation
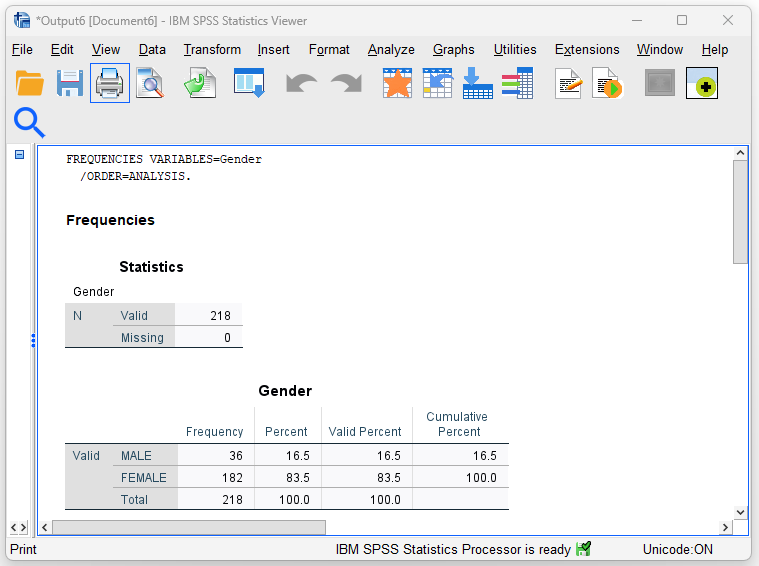
- Total participants: 218
- Male: 36 participants (16.5%)
- Female: 182 participants (83.5%)
This frequency analysis summarizes the distribution of a categorical variable.
3. Descriptive Statistics Example 2: Mean of Age
Goal
Find the mean (average) age.
Steps
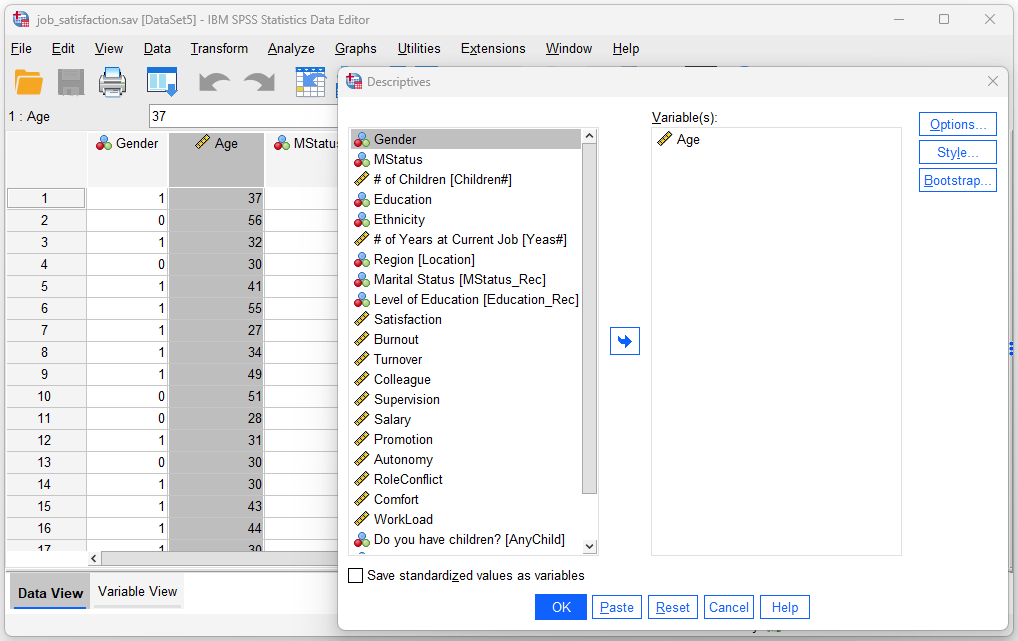
- Click Analyze.
- Select Descriptive Statistics → Descriptives.
- Move the Age variable into the analysis box.
- Click OK.
Output Interpretation
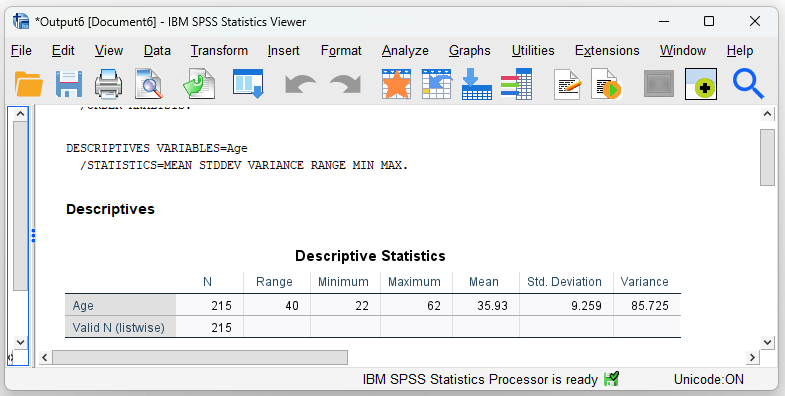
- Valid cases: 215
- Missing cases: 3 (participants without age data)
- Age range: 22 to 62
- Mean age: 35.93 years
This analysis provides summary statistics such as the mean, minimum, maximum, and range.
4. Inferential Statistics Example: Correlation Analysis
Important note:
This example is for illustrative data analysis practice only and is not intended for theoretical testing.
Goal
Examine whether there is a relationship between age and job satisfaction.
Steps
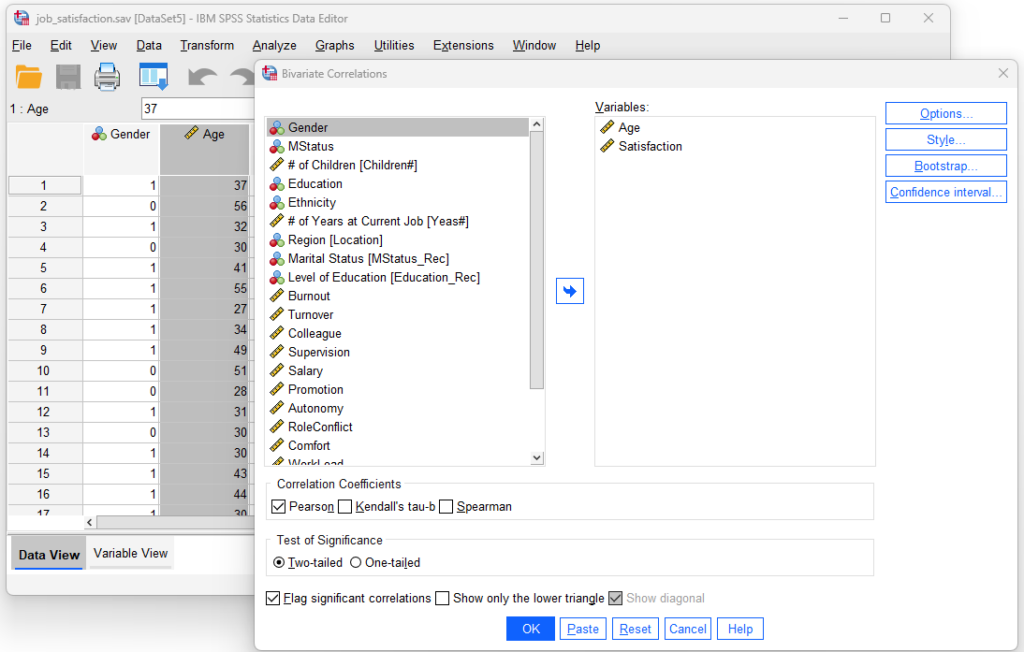
- Click Analyze.
- Select Correlate → Bivariate.
- Move both Age and Satisfaction into the variables box.
- Ensure Pearson correlation is selected (default).
- Click OK.
Output Interpretation
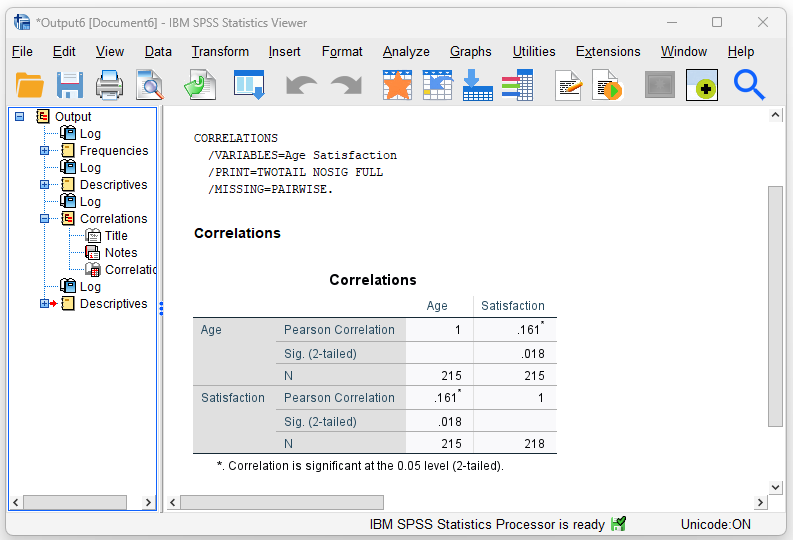
- Pearson correlation coefficient: r = 0.161
- Significance (p-value): 0.018
This result indicates a positive and statistically significant correlation, meaning that higher age is associated with higher job satisfaction in this dataset.
5. Key Takeaways
- Data View shows raw data; Variable View explains how data are coded.
- SPSS allows you to perform both descriptive statistics (e.g., frequencies, means) and inferential statistics (e.g., correlations).
- You do not need to analyze all variables at once—analyses should be guided by the specific question you want to explore.
- This tutorial serves as a practical introduction to SPSS, helping you get started with basic data analysis.
You can also watch the combined version of the tutorial below:
Extra Reading:
SPSS Measure: Nominal, Ordinal, and Scale
Discussion