SPSS Tutorial for Beginners: Data vs. Variable Views and Descriptive Statistics
This tutorial provides an introduction to using SPSS for basic data analysis. You will learn how to navigate the SPSS interface and perform simple descriptive analyses using an example dataset. The goal is to help beginners become familiar with key SPSS functions through hands-on practice.
Dataset Download Link: ![]() Job Satisfaction data (Click here to download).
Job Satisfaction data (Click here to download).
You can download the sample dataset and pratice along with this tutorial.
1. Data View
When you first open SPSS and load a dataset, you will see the Data View window.
- Each column represents a variable (e.g., gender, age, marital status).
- Each row represents a participant or case.
- In the example dataset, there are 218 participants, each represented by one row.
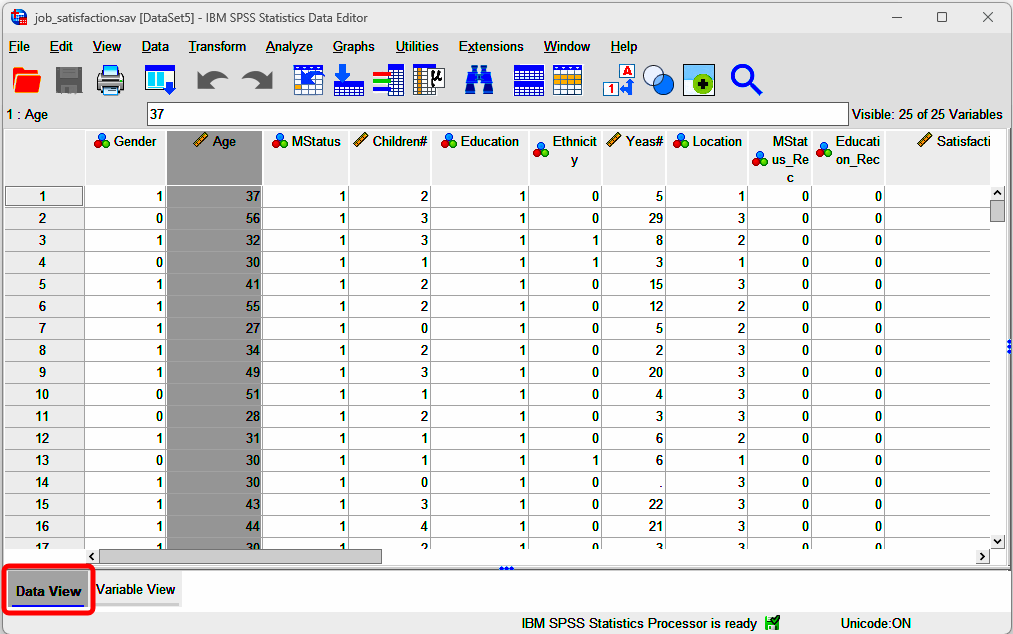
You may notice that all variables are coded numerically (e.g., gender coded as 0 and 1). It should be noted that data can be coded with letters or words as well in SPSS (e.g., you can use M and F to represent male and female). Anyhow, for the data example presented here, gender is coded with numbers (i.e., 0 and 1), to understand what these numbers mean, you need to switch to Variable View (see next section).
2. Variable View
- Click Variable View
- Click the cell in the column of Values for the first row (i.e., the row of Gender)
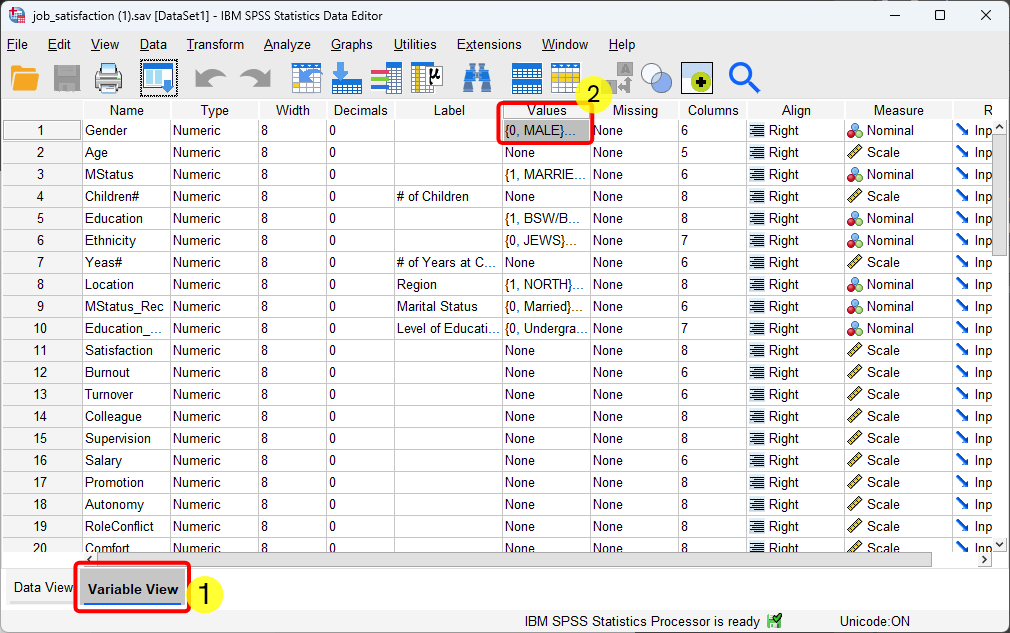
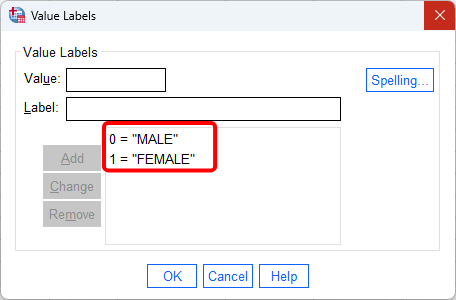
Variable View provides information about how each variable is defined. Under the Values column, you can see value labels. For example, Gender: 0 = Male, 1 = Female. This view helps you interpret the numerical codes shown in Data View. Further, if you want, you can click the following video to hear and watch the explanation of data view window in SPSS.
3. Descriptive Statistics Example 1: Frequency Analysis for Gender
Frequency analysis summarizes data by counting how often each category occurs in a dataset. For example, it can show how many males and females are in a dataset, making it easy to compare their frequencies.
In the following, I will show the steps of doing frequency analysis on the variable of gender. After that, I will explain the results of the frequency analysis.
Goal
Determine how many participants are male and female in the dataset.
Steps
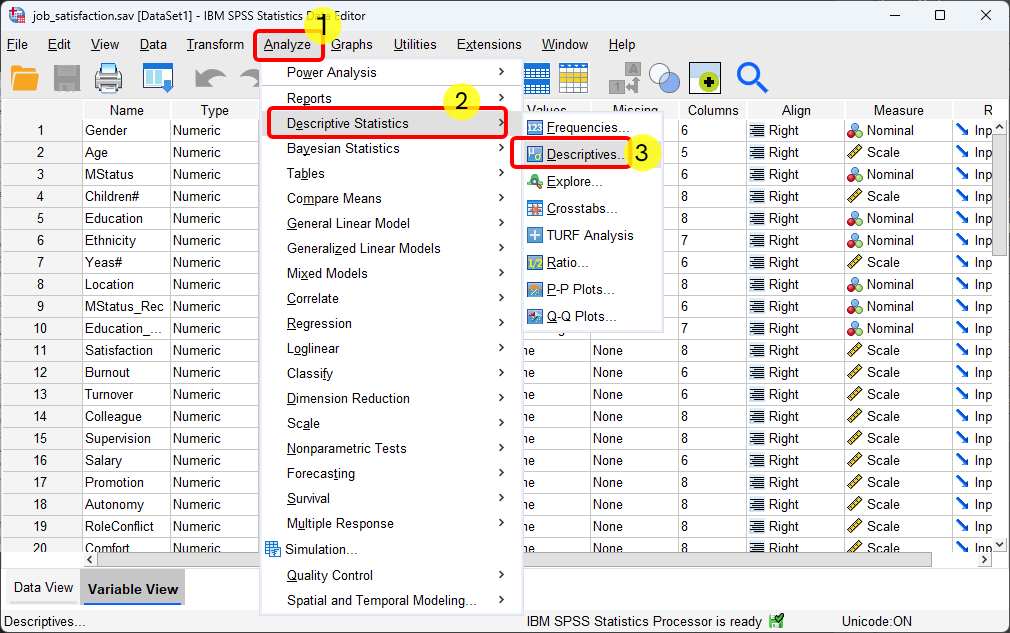
- Click Analyze in the top menu.
- Click Descriptive Statistics
- Click Frequencies
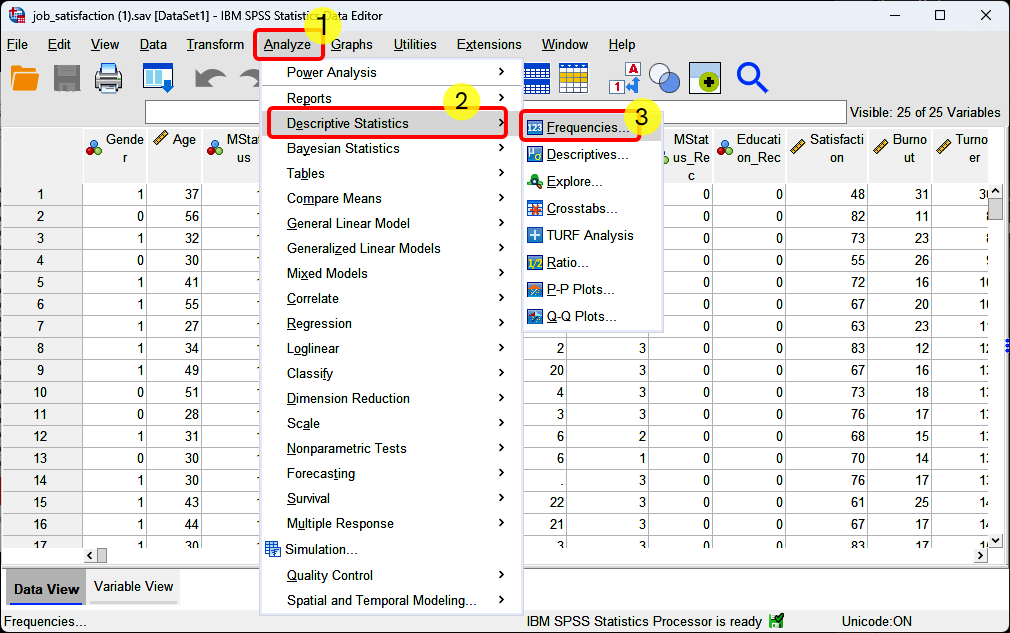
- Select Gender
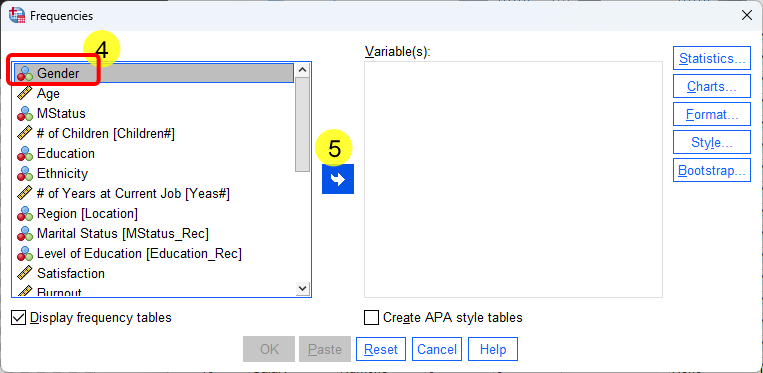
- Click the arrow button
 to move Gender to the right side of Variable(s) box.
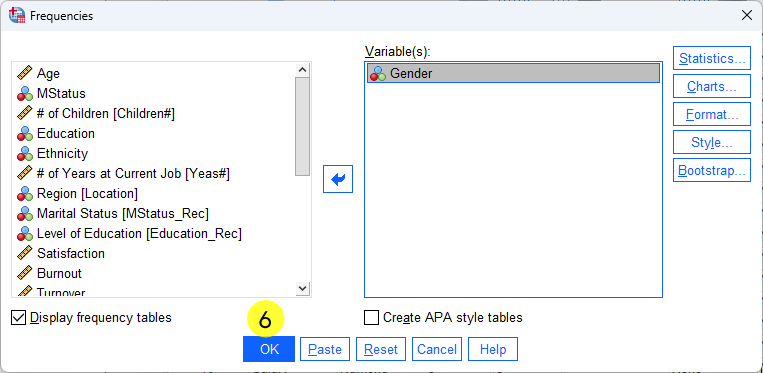
 - Click
 .
.
Output Interpretation
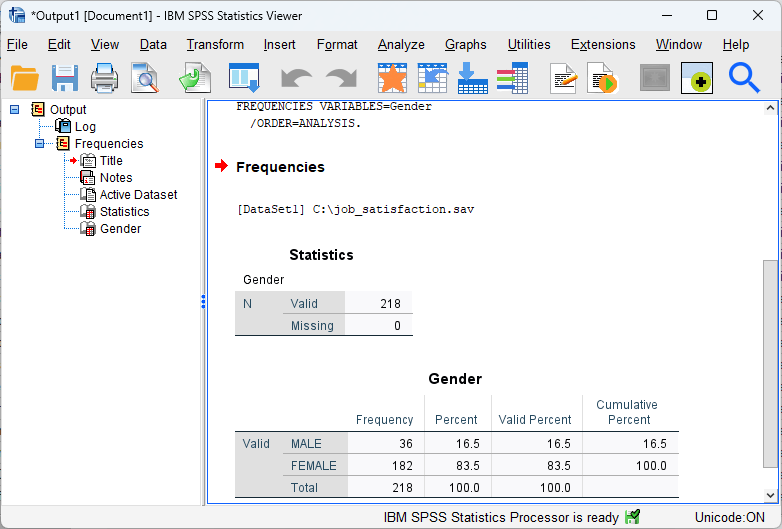
- Total participants: 218
- Male: 36 participants (16.5%)
- Female: 182 participants (83.5%)
This frequency analysis summarizes the distribution of a categorical variable. The results show that there were a total of 218 participants in the study. The majority were female, with 182 participants (83.5%), while males accounted for 36 participants (16.5%). Further, if you want, you can click the following video to hear and watch the explanation of the step by step of doing frequency analysis in SPSS.
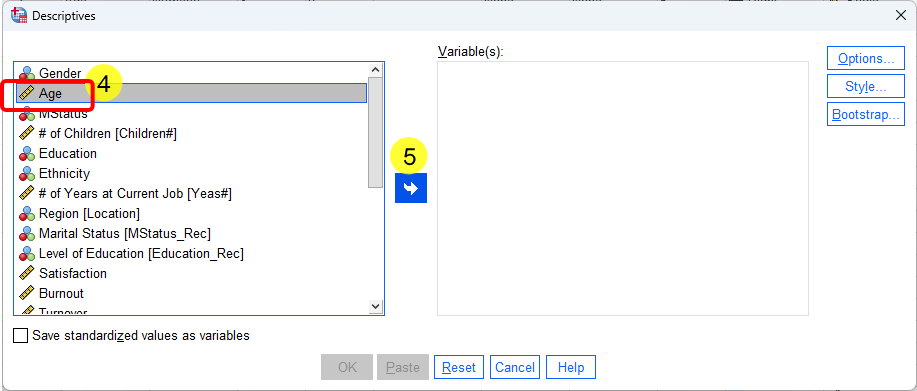
3. Descriptive Statistics Example 2: Mean of Age
Goal
Find the mean (average) age.
Steps
- Click Analyze
- Click Descriptive Statistics
- Click Descriptives
- Click the Age variable
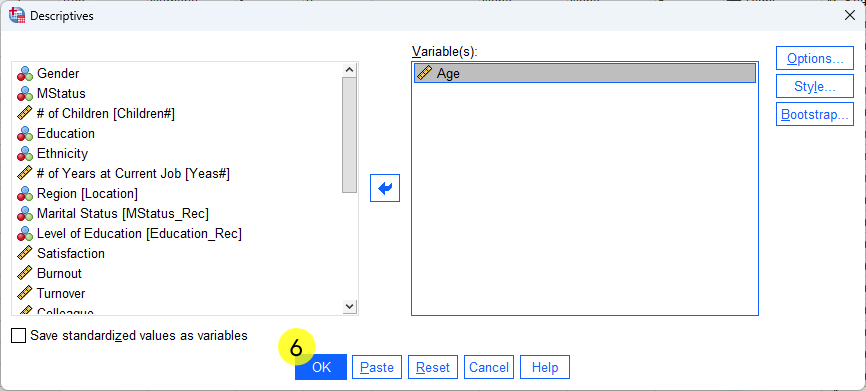
- Click the blue arrow button and move it into the analysis box.
- Click .
Output Interpretation
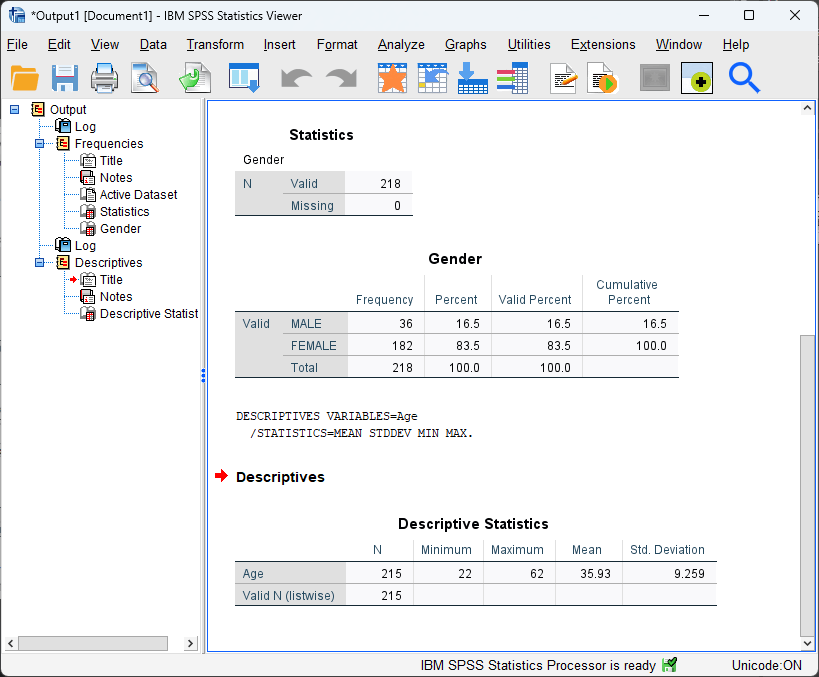
- Valid cases: 215
- Missing cases: 3 (participants without age data)
- Age range: 22 to 62
- Mean age: 35.93 years
This analysis provides summary statistics such as the mean, minimum, maximum, and range. In particular, the mean analysis of age was based on 215 valid cases, with 3 participants excluded due to missing age data. Participants’ ages ranged from 22 to 62 years. The mean age of the sample was 35.93 years, indicating that most participants were in their mid-thirties. Further, you could click the following video to hear and watch the explanation of the step by step of conducting the mean analysis for age in SPSS.
5. Summary
In summary, this tutorial introduces beginners to SPSS by showing how to navigate the interface and conduct basic descriptive analyses using a Job Satisfaction dataset (218 participants). It explains the difference between Data View (where rows are cases and columns are variables) and Variable View (where variables are defined and numerical codes are labeled, such as Gender: 0 = Male, 1 = Female). The tutorial then demonstrates two descriptive examples: a frequency analysis of gender (36 males, 16.5%; 182 females, 83.5%) and a mean analysis of age based on 215 valid cases (3 missing), with ages ranging from 22 to 62 and a mean age of 35.93 years. Video links are also provided to support step-by-step learning and interpretation of output.
Discussion