Calculate Correlation Coefficient and P-value In Excel
This tutorial shows how you can calculate correlation coefficient and p-value in Excel. In particular, this tutorial will include data examples and calculation processes in Excel.
Step 1: Data used for correlation analysis in Excel
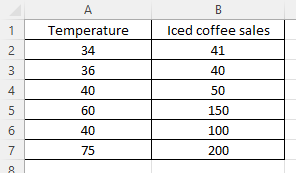
We are going to use the data used in another tutorial, namely temperature and iced coffee sales. We want to test if there is a relationship between temperature and iced coffee sales via correlation analysis. The following is the data shown in Excel: one column is temperature and one column is iced coffee sales.
Step 2: Calculate correlation coefficient in Excel
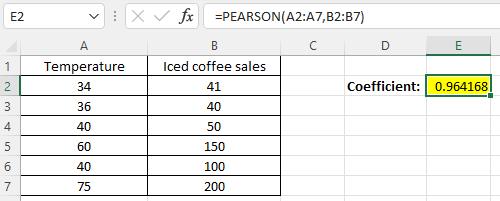
In this tutorial, we are going to focus on pearson correlation. Since we are going to use Excel, we will just use Excel function pearson() to calculate correlation coefficient. In particular, as shown below, A2:A7 represent data for temperature, whereas B2:B7 is data for Iced coffee sales. Thus, we get the correlation coefficient = 0.96.
Step 3: Calculate t-statistic for correlation coefficient
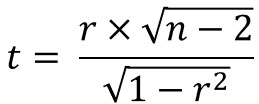
We can use the following formula to calculate the t-statistic for the correlation coefficient. The meanings of r and n are explained below.
- r represents the correlation coefficient calculalted in step 2.
- n represents the number of observations. It is 6 for the example used in this tutorial.
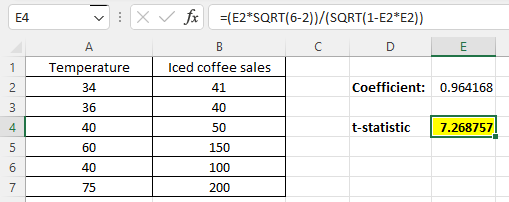
We can write the following in Excel, replacing r and n with the example numbers.
=(r*sqrt(n-2))/(sqrt(1-r*r))
The following is the screenshot of calculating the t-statistic for the correlation coefficient in Excel. As we can see, t value is 7.27.
Step 4: Calculate p-value for correlation coefficient in Excel
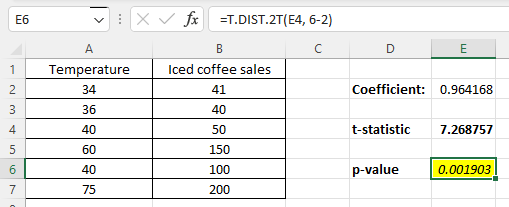
In step 4, we are going to calculate p-value for the correlation coefficient in Excel. In particular, we need to write out a formula to do it and the following is the basic format. The meanings of t and degree of freedom are explained below.
=t.dist.2t(t, degree of freedom)
- t is the t-statistic calculated in step 3
- degree of freedom is the number of observations n minus 2: n-2
The following is the screenshot of Excel showing what it looks like to calculate p-value in Excel. As we can see, the p-value is 0.0019, which is smaller than 0.05. Thus, we can conclude that temperature and iced coffee sales are significantly correlated. In other words, temperature impacts iced coffee sales.
There is an alternative method to write the formula in Excel to calculate p-value. The basic format is as follows. In particular, you can specify one tail or two tails in t-test. If it is 2 tails, you can use number 2.
=tdist(t, degree of freedom, tails)=tdist(t, degree of freedom, 2)
If you want to download the Excel used in this tutorial, you can click this GitHub link, which includes data example, formulas to calculate correlation coefficient, t-statistic, and p-value.