Calculate two-sample t-test and its P-value in Excel
This tutorial shows how you can calculate two-sample t-test and its p-value in Excel. This tutorial will include detailed examples and steps.
Steps of Calculating two-sample t-test and p-value in Excel
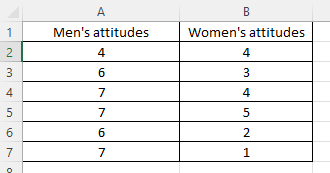
Step 1: Data used for t-test
The following is the data used for t-test. The data are women and men’s attitudes toward a brand and the attitude is measured on a 7-point scale (1= Not like at all, 7 = Like it a lot). Thus, t-test is to test if men and women differ in terms of brand attitudes.
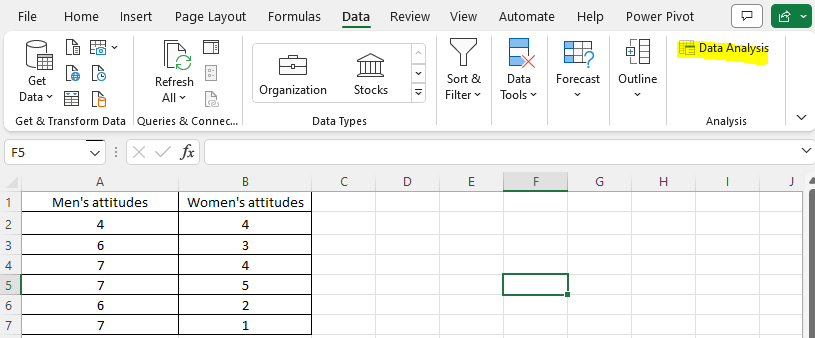
Step 2: Find the t-test interface
You need to click the “Data” and then “Data Analysis”, see below.
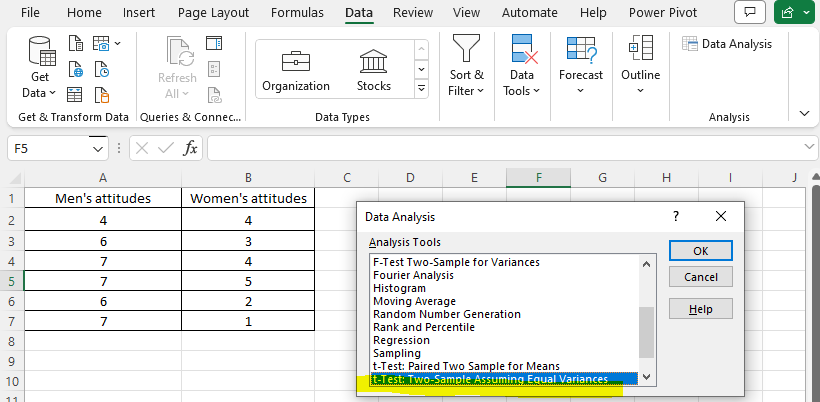
Then, choose “t-Test: Two-sample assuming equal variances”, see below. Note that, you also need to test if the variances across these two groups are equal. (But, this tutorial skips this step.)
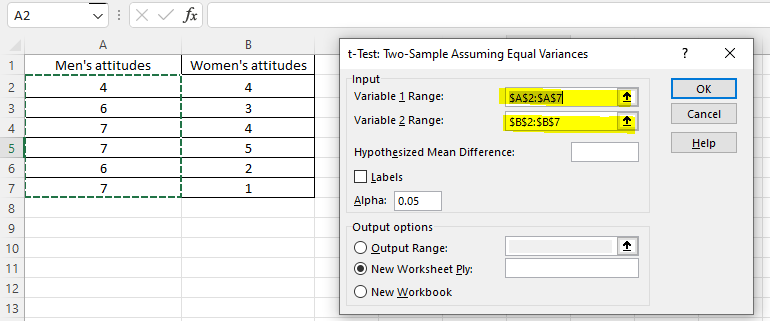
Then, select A2:A7 as variable 1, whereas B2:B7 as variable 2. Then, click OK.
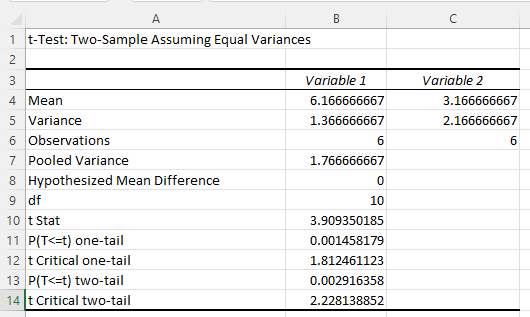
Step 3: Interpret the Excel output for two-sample t-test
The following is the output, which is automatically opened as an independent sheet in Excel. As we can see, df stands for degree of freedom. “t Stat” is the t-statistic for t-test, which is 3.91. There are two p-values, depending on one-tail and two-tail. If without prior theorizing, we opt for two-tail. For two-tail, p-value is 0.0029. We can report it as t(10)=3.91, p = 0.0029.
Since p-value is smaller than 0.05, we reject the null hypothesis. Thus, we conclude that men and women differ in terms of brand attitudes. From the means, we can see the mean of men’s attitudes is 6.17, whereas the mean of women’s attitudes is 3.17. Accordingly, we can conclude that men have significantly more favorable attitudes than women.
If you want to use the Excel file used in this tutorial, you can click this link to download from Github. This Excel file include data, formulas, and output for the two-sample t-test.