Data Type and Data Summary
This tutorial explains what data type (including numerical data and categorical data) is and how to summarize different types of data.
Data Type
Broadly speaking, data can be categorized into two types: categorical and numerical. Categorical data refers to variables that have a finite number of categories or groups. Examples of categorical data include gender (e.g., male vs. female vs. non-binary) and race (e.g., white, black, Asian, …), and student class (freshman, sophomore, junior, and senior).
On the other hand, numerical data refers to variables that have measurable quantities or values. Examples of numerical data include age (e.g., 18, 19, 20, …, 99), temperature (e.g., 50, 70, 56, …, 66), and brand attitude measured on a 7-Likert scale 1 = Not like it at all and 7 = Like it a lot (e.g., 1, 2, 2, 7, 6, 5, …, 4).
It is worth noting that, you can not know what the data type is just based on the variable name. For instance, age can be both numerical data and categorical data. In particular, if you measure participants’ age on numerical scale and the result looks like 81, 21, …55, 18, …, 99, and 100, such data is numerical data. In contrast, if you just measure participants’ age using the categorical lables such as Millennial (1981 and 1996) and Gen Z (1997-2012) (see reference), such data is a categorical data.
Data Summary
Categorical data are often represented using frequencies or percentages. For instance, the following is an example of categorical data of gender.
To summarize the data, we use frequency such that, there are 3 males and 4 females. You can also use percentage as well such that there are 3/7 = 42.86% male and 4/7= 57.14% female. As you can see, frequencies and percentages are basically communicating the same information for categorical data.
| Gender | Name | Age |
| Male | Jake | 18 |
| Female | Lucy | 18 |
| Male | John | 24 |
| Female | Lily | 35 |
| Female | Alison | 24 |
| Female | Jessica | 50 |
| Male | Jackson | 30 |
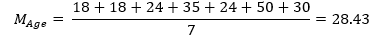
In contrast, numerical data are often analyzed using measures of central tendency such as mean, median, and mode. For instance, the mean of age is 28.43.
Further Reading
Below are two other tutoricals about basic statistics.
Quartile: Definition and Example
Difference between Descriptive Statistics and Inferential Statistics
Discussion