How to Create Contingency Table in Excel
You can create a contingency table in Excel using the Pivot Table. This tutorial includes steps showing how to create a contingency table for count data.
Data and Resarch Question for Contingency Table
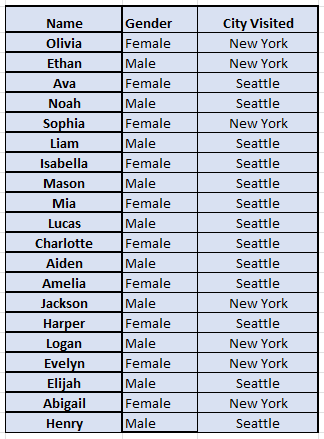
The following is the sample data used in Excel. It is a hypothetical data record showing a group of 20 participants’ recent visits to New York or Seattle in the holiday season.
For this data, you can ask the research question of how gender impacts people’s choice of cities to visit. To address this question, you can use a contingency table.
Steps of Creating a Contingency Table in Excel
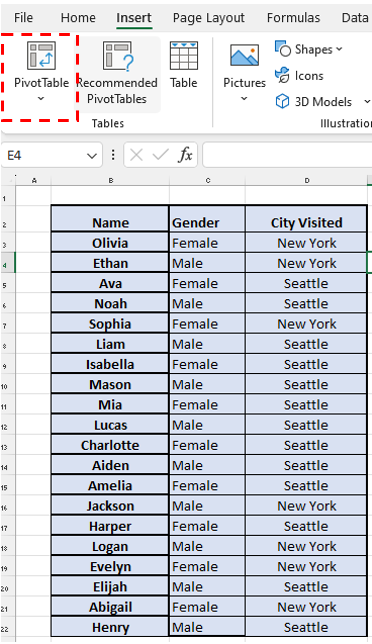
Step 1: Select the “PivotTable”
Click “Insert” and then select “Pivot Table.”
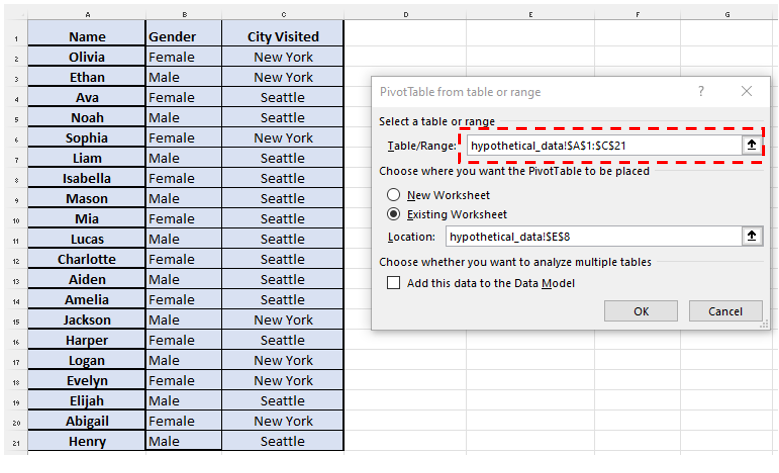
Step 2: Select all cells in “Table/Range”
On the PivotTable pop-up window, you select all the cells in the box of “Table/Range.” In the following, it selects from A1 to C21. Then, click OK.
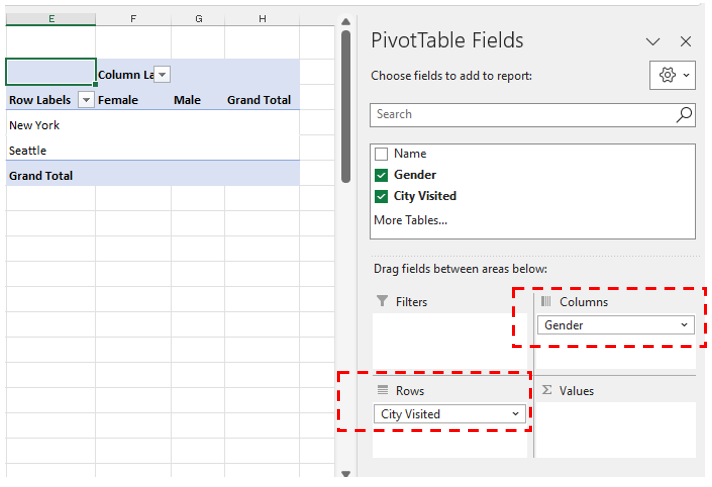
Step 3: Drag variables to columns and rows
You can drag Gender to the box of Columns and City Visited to Rows.
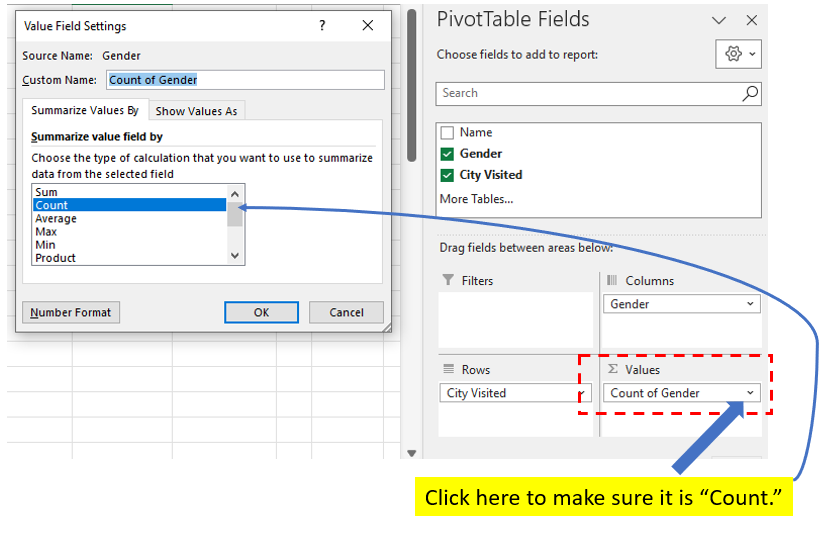
Step 4: Drag a variable to “Values” and set it as “Count”
Drag either Gender or City Visited into the “Values” box, and click it to make sure you select “Count.” Note that, either Gender or City Visited in the Values box will get the same frequencies in 4 cells in the contingency table.
Interpretations of Contingency Table
The following is the generated contingency table in Excel. The following are the meanings of cells in the contingency table. In particular, (1) Cell number 4 means that 4 female participants visit New York; (2) Cell number 3 means that 3 male participants visit New York. (3) Cell number 6 means that 6 female participants visit Seattle. (4) Cell number 7 means that 7 male participants visit Seattle
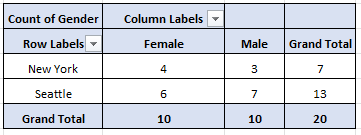
To further understand this table, we need to calculate the percentages. There are different ways to look at this table, depending on your focuse.
For the research question asked earlier, we can see that in general, there are more people visiting Seattle than New York, regardless females or males. But, it seems that males show stronger preference of Seattle than females (70% vs. 60%). (Remember, this is hypothetical data.)
| Female | Male | Grand Total | Ratio (Male/Grand Total) | |
| New York | 4 | 3 | 7 | 43% |
| Seattle | 6 | 7 | 13 | 54% |
| Grand Total | 10 | 10 | 20 | 50% |
| Ratio (Seattle/Total) | 60% | 70% | 65% |
Further Reading
Below is a YouTube tutorial on how to create a contingency table in Excel.
Discussion