One Sample t-test in SPSS
This tutorial shows how you can do one sample t-test in SPSS. One sample t-test is to compare a sample to a fixed value.
For instance, you can compare whether the average score of students’ reading is different from 45. In the following, I am going to show how you can do that in SPSS. You can download the data ![]() hsbdemo.sav.
hsbdemo.sav.
1. Steps of One sample t-test in SPSS
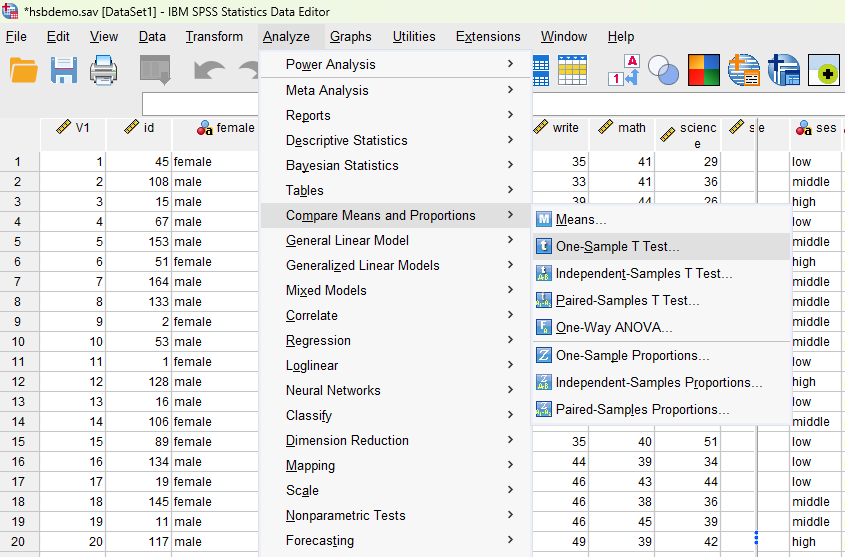
- Click Analyze -> Compare Means and Proportions, then One-Sample T Test.
- Select
 from left and click the right arrow button
  into Test Variable(s) window on the right.
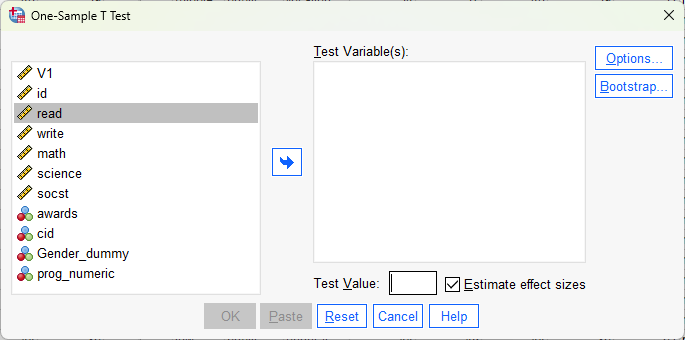
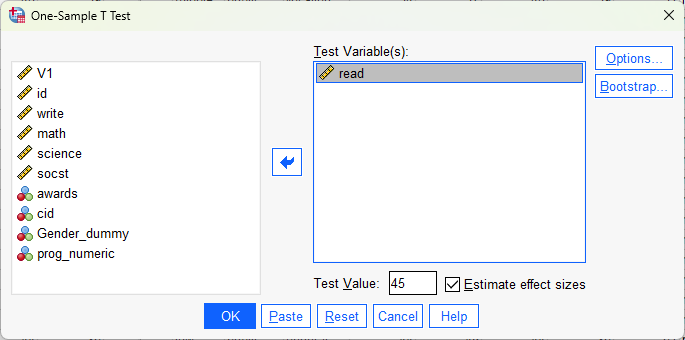
- After appears in the Test Variable(s) window, type “45” into “Test Value.” Then click
 .
.
2. Interpret Output of One Sample t-test in SPSS
The following are the null and alternative hypotheses for one sample t-test:
- Null Hypothesis: The mean of reading scores is not different from 45.
- Alternative Hypothesis: The mean of reading scores is different from 45.
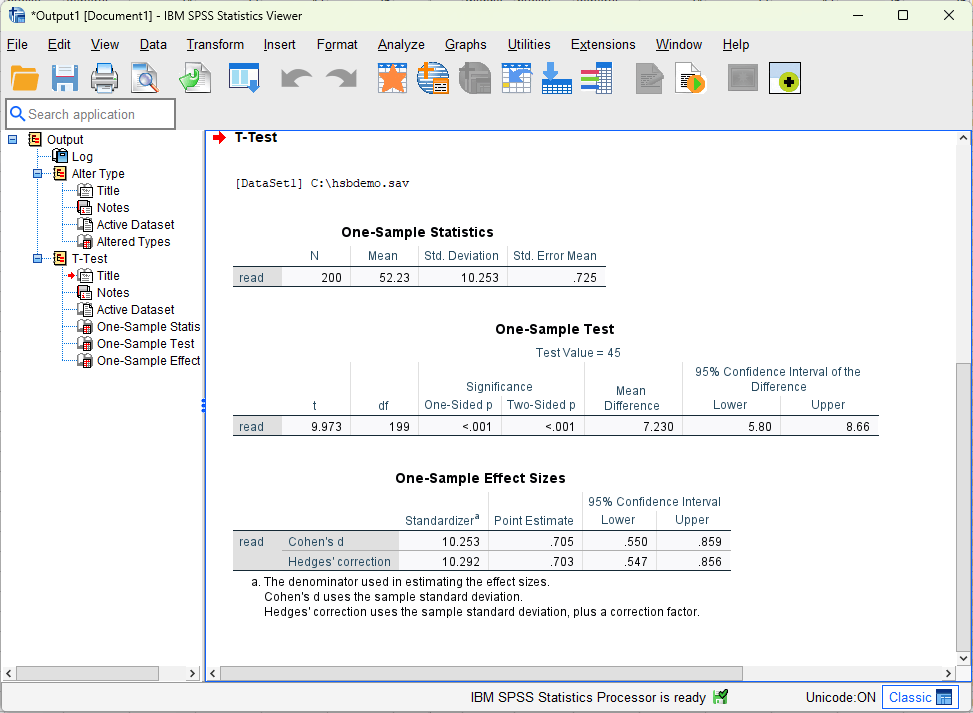
The following is the output. We can see that the mean is 52.23. Further, the p-value is smaller than 0.001. Thus, we reject the null hypothesis and conclude that the mean of reading scores (i.e., 52.23) is significantly different from 45.
Further Reading
This tutorial is about one sample t-test in SPSS. There are two types of other t-test, namely two sample t-test and paired sample t-test. You can check the tutorial below, which discusses the relationship and difference between these three types of t-test.
The following includes tutorials for another two types of t-test in SPSS.