Paired t-test in SPSS
This tutorial shows how you can conduct paired t-test in SPSS. The following shows the specific steps with screenshots from SPSS.
We are going to test whether students’ writing scores and reading scores are different. You can download the data here.
Steps of Paired t-test in SPSS
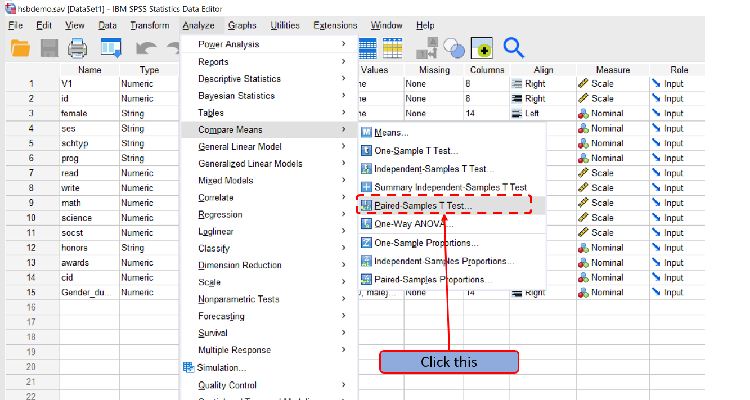
Step 1: Click “Paired Sample T-Test”
Click “Analyze”, then “Compare Means”, then “Paired Sample T-Test.”
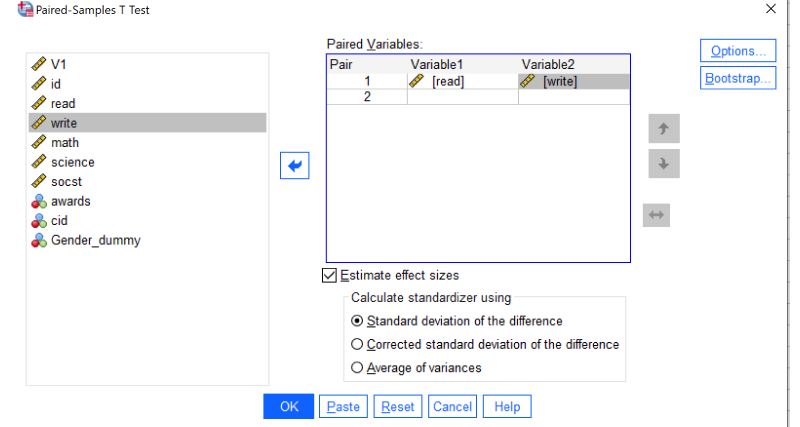
Step 2: Drag variables
Drag “read” and “write” to Variable 1 and Variable 2 respectively.
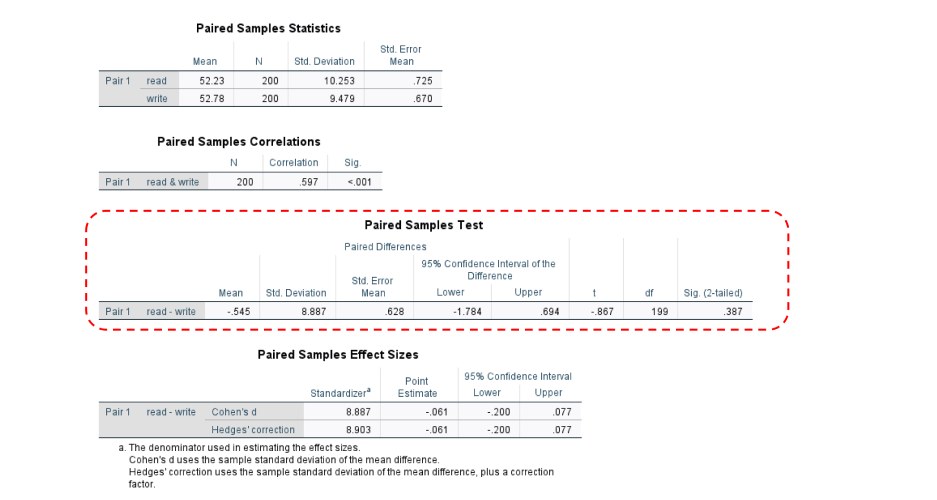
Step 3: Interpret the output
The following are the null and alternative hypotheses for the paired t-test.
Null Hypothesis: Writing and Reading are not different.
Alternative Hypothesis: Writing and Reading are different.
The mean for reading is 52.23 and the mean for writing is 52.78. The P-value of 0.387 is greater than 0.05. That means that we failed to reject the null hypothesis. Therefore, we conclude that writing and reading scores are not significantly different.
Further Reading
The following shows other tutorials in SPSS.