Simple Linear Regression in SPSS
This tutorial shows how to do simple linear regression in SPSS step by step. Simple linear regression estimates the linear relationship between one independent variable and one dependent. In this tutorial, we test whether students’ writing scores can be used to predict reading scores.
Read = b0 + b1 Write
This dataset in this tutorial has been used in some other tutorials online (See UCLA website and another website). You can download the SPSS SAV file here.
Steps of Simple Linear Regression in SPSS
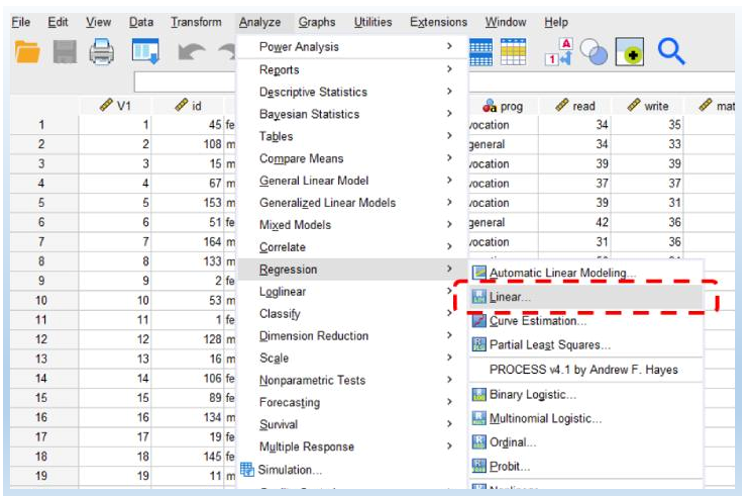
- Click Analyze > Regression > Linear.
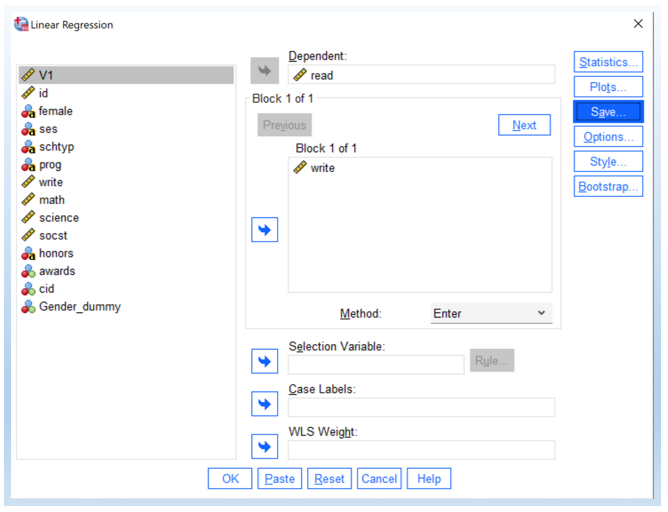
- Drag “read” as “Dependent” and “write” in “Block 1 of 1.” Then, hit OK to see the output.
Interpret the linear regression output
The following is the key output. The p-value for “write” is < 0.001, which indicates that it is significant. In other words, writing scores can be used as a predictor for reading scores.
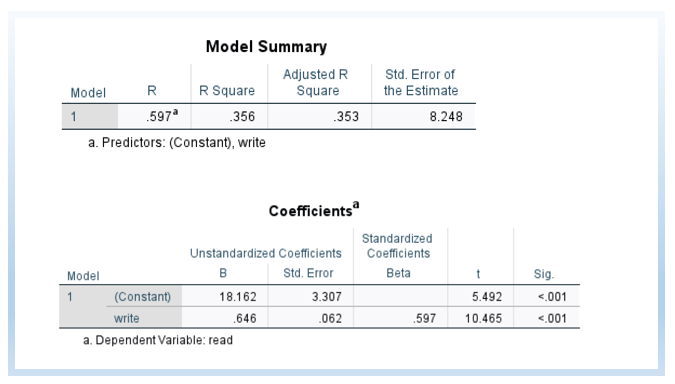
We can also write out the model statement as follows. It means that, for writing scores to increase by 1 unit, reading scores will increase by 0.65 units.
Read = b0 + b1 Write = 18.16 + 0.65 Write
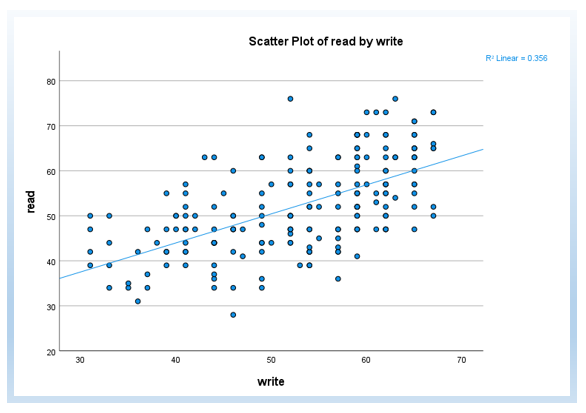
Scatter Plot with Predicted Line
One way to better understand linear regression is to plot the scatter plot with a predicted line. I have another detailed tutorial on how to do that (click here). The following plot shows the linear regression between write and read. In addition, R2 = 0.356 shown in the plot suggests that write explains 35.6% of the variance of read.