How to Calculate Two-Factor ANOVA without Replication
ANOVA Two-Factor without Replication is used for a design of two factors (e.g., Factor A and Factor B) and only 1 observation in each cell.
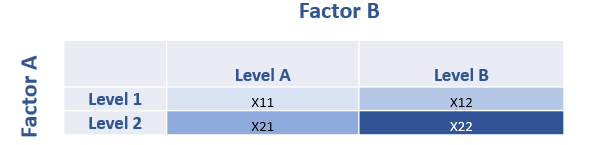
For instance, both Factor A and Factor B have two levels, leading to 4 cells in total. Each cell only has 1 observations (see below).
Variance Partitioning
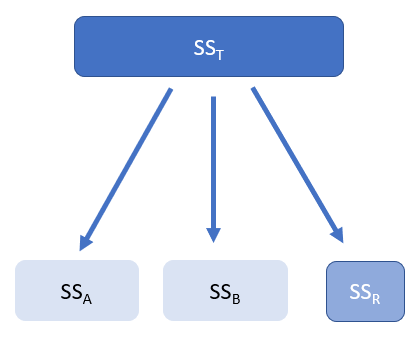
Two-Factor ANOVA without Replication (SST) can be broken down into 3 part, SSA, SSB, and SSR. The following is the figure showing the variance partitioning.
Formulas
The following shows the formulas for each components, including
\( SS_T=SS_A+SS_B+SS_R \)
For SST, you can use the following formula.
\( SS_T=\sum \sum (x_{ij}-\bar{x})^2 \)
where,
- \( i \) represents \( i^{th} \) row, \( j \) represents \( j^{th} \) column.
- \( x_{ij} \) represents observation at \( i^{th} \) row and \( j^{th} \) column.
- \( \bar{x}\) is the grand mean of all the cells.
For SSA, the following is the formula.
\( SS_A= \sum n_i (\bar{x_i} -\bar{x})^2 \)
where,
- \( n_i \) represents the number of observations for \( i^{th} \) row.
- \( \bar{x_i}\) is the mean of observations for \( i^{th} \) row.
- \( \bar{x}\) is the grand mean of all the cells.
For SSB, the following is the formula.
\( SS_B= \sum n_j (\bar{x_j} -\bar{x})^2 \)
where,
- \( n_j \) represents the number of observations for \( j^{th} \) column.
- \( \bar{x_j}\) is the mean of observations for \( j^{th} \) column.
- \( \bar{x}\) is the grand mean of all the cells.
The formula for SSR is as follows.
\( SS_R = \sum \sum (x_{ij}-\bar{x_i}-\bar{x_j}+\bar{x})^2 \)
where,
- \( x_{ij} \) represents observation at \( i^{th} \) row and \( j^{th} \) column.
- \( \bar{x_i}\) is the mean of observations for \( i^{th} \) row.
- \( \bar{x_j}\) is the mean of observations for \( j^{th} \) row.
- \( \bar{x}\) is the grand mean of all the cells.
Note that, since \( x_{ij} \) is exactly the same as \( \bar{x_{ij}}\), you can not use the the same formula for SSR in two-factor ANOVA with replication. Instead, SSR here is the similar to interaction effect SSAB in Two-Factor ANOVA with replication.
Calculate by Hand
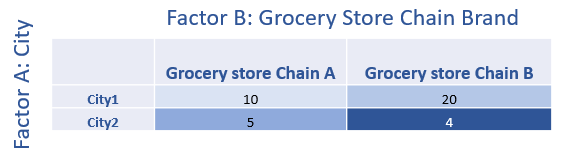
The following is the data example used here.
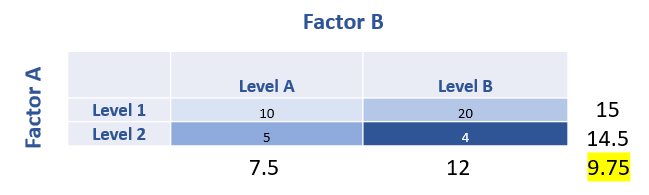
We can calculate the row and column means and grand mean as follow.
We can calculate SSA, SSB, and SSR as follows.
SST= (10-9.75)2 + (20-9.75)2 +(5-9.75)2 +(4-9.75)2 =160.75
SSA= 2(15-9.75)2 + 2(14.5-9.75)2 =110.25
SSB= 2(7.5-9.75)2 + 2(12-9.75)2 =20.25
SSR= (10-7.5-15+9.75)2 + (20-12-15+9.75)2 +(5-7.5-14.5+9.75)2 +(4-12-14.5+9.75)2 =30.25
Thus, we can see that SSA+SSB+SSR =160.75 = SSR.
We can calculate MSA, MSB, and MSR as follows. Since all the degree of freedom is 1 for all of them. We can get the following.
MSA= SSA / dfA=110.25/1=110.25
MSA =SSB /dfB =20.25/1=20.25
MSR = SSR /dfR= 30.25/1=30.25
Finally, we can calculate the F-ratios as follows.
FA=MSA / MSR =110.25/30.25=3.64
FB=MSB / MSR =20.25/30.25=0.67
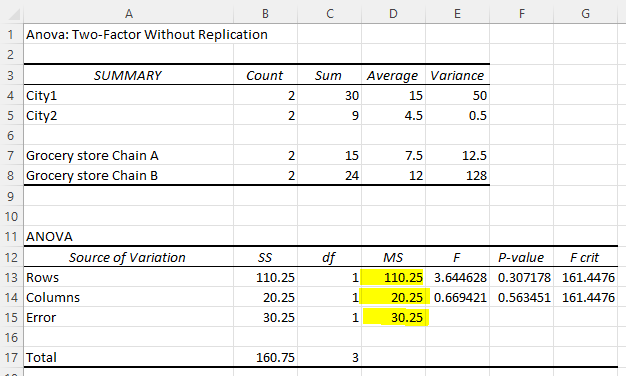
You can compare the output here with the output shown below using Excel. You can see that the results are the same.
Calculate using Excel
This section is to explain how to do ANOVA Two-Factor without Replication in Excel.
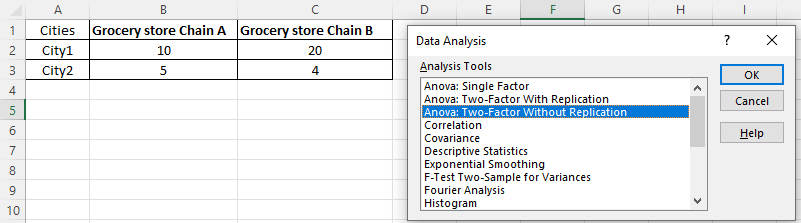
Step 1: Select menu options in Excel
You can select ANOVA: Two-Factor without Replication in Excel and click OK.
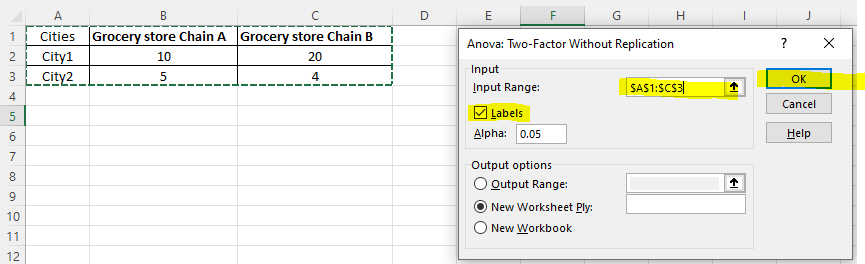
Step 2: Set data range in Excel
Then, you select A1 to C3 to the Input Range, click “Lables” and then “OK.”
Step 3: Interpretation of the Excel output from two-factor ANOVA without Replication
The following are the null and alternative hypotheses for the effect of City.
- Null Hypothesis: City 1 and City 2 do not differ in sales.
- Alternative Hypothesis: City 1 and City 2 do differ in sales.
The following are the null and alternative hypotheses for the effect of Chain Brand.
- Null Hypothesis: Chain Brand A and Chain Brand B do not differ in sales.
- Alternative Hypothesis: Chain Brand A and Chain Brand B do differ in sales.
The following is the output from Excel. For the effect of City on sales, the p-value is greater than 0.05, and thus we fail to reject the null hypothesis. In other words, City 1 and City 2 do differ in sales.
For the effect of Chain Brand on sales, the p-value is greater than 0.05 and thus we fail to reject the null hypothesis. In other words, Chain Brand A and Chain Brand B do differ in sales.
Further Reading
There are tutorials on this site on Two-factor ANOVA with replication. You can check them out to have a better understanding on this topic.
- Two-Way ANOVA: Formula and Example (with replication)
- Two-Way ANOVA in Excel (with replication)
Finally, the following is a reference outside of this site.
Discussion