Two-Way ANOVA in Excel
This tutorial shows how you can do two-way ANOVA in Excel. Different from one-way ANOVA, two-way ANOVA has two independent variables. Note that, two-way ANOVA is also called two-factor ANOVA.
Prepare data and hypothesis writing
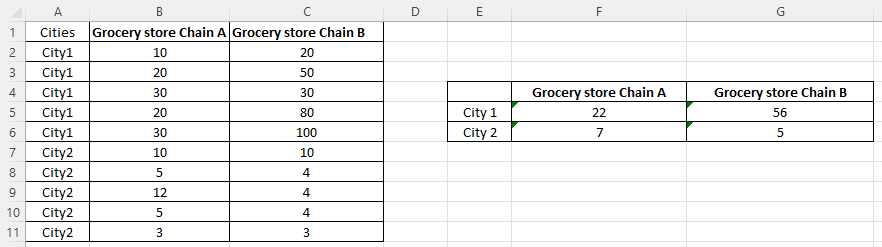
Suppose Brand A sells its products in city1 and city2, each city with 2 grocery store chains (Grocery store Chain A and Grocery store Chain B). Each grocery store chain has 5 stores in each city.
You can download this Excel file of two-way ANOVA used in this tutorial via GitHub.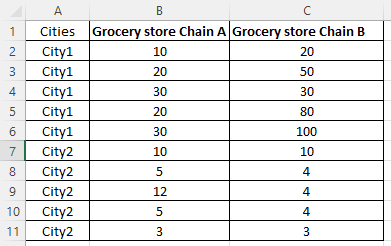
Thus, two-way ANOVA can test the following hypotheses.
Null hypothesis: The sales difference between Grocery store Chain A and Grocery store Chain B does not differ between city1 and city2.
Alternative hypothesis: The sales difference between Grocery store Chain A and Grocery store Chain B does differ between city1 and city2.
Steps of Two-way ANOVA in Excel
- Click Data Analysis on the top menu.
If you can not find it, please check my another tutorial – How to fix: Data Analysis not Show up in Excel.
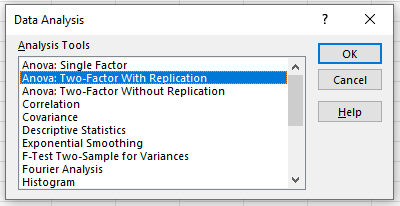
- Select “ANOVA: Two-Factor with Replication” and then click “OK.”
- Select A1 to C11 into “Input Range“. Remember to include the first row and first column.
Then, set “Rows per sample” to 5, since each chain has 5 stores in each city. Then, click “OK“.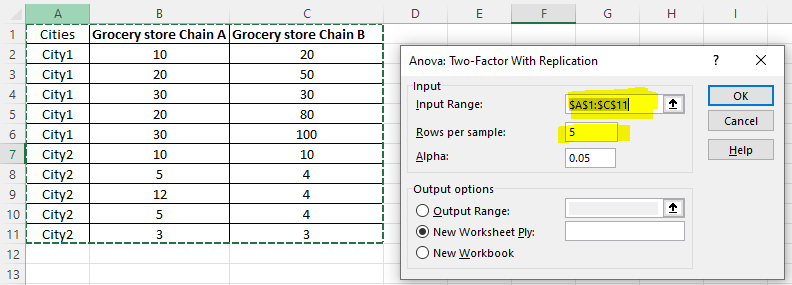
Report findings of Two-way ANOVA
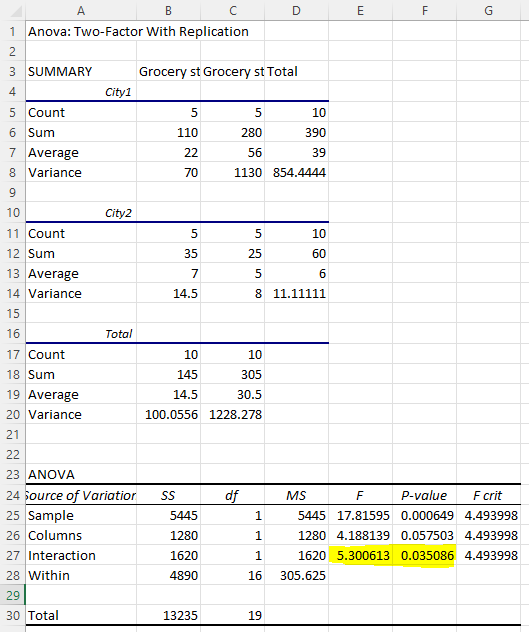
Based on the output shown below, you can report the two-way ANOVA Excel results as follows:
We tested two-way ANOVA and found that F(1,16) = 5.30, p = 0.035. Since the p-value = 0.035, which is smaller than 0.05, we reject the null hypothesis. We thus conclude that the sales difference between Grocery store Chain A and Grocery store Chain B does differ between city1 and city2.
Understand the two-way ANOVA significant interaction effect
We got p-value = 0.035. But, what does it mean? To better understand the meaning of this significant effect, we need to do a plot of means. In particular, we calculate 4 means and the following is the screenshot.
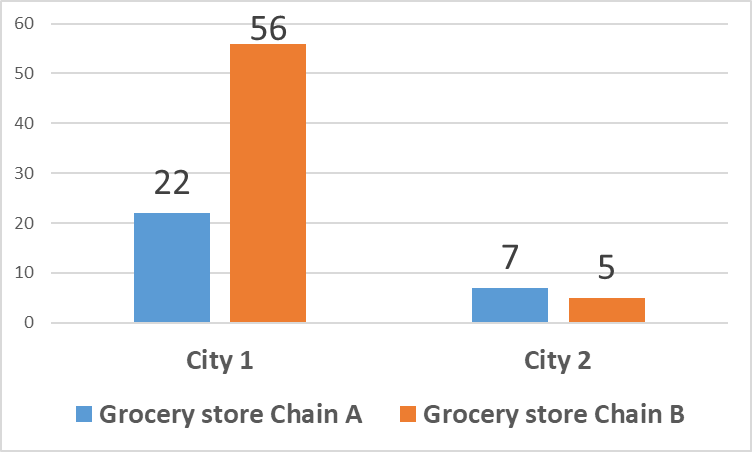
To have a better understanding, we can do a bar chart plot in Excel. The following is the bar chart. We can see that, overall, City 1 has higher sales than City 2. Further, the difference between Chain A and Chain B in City 1 is 56-22=34, which is much greater than the same difference in City 2 (7-5=2). Thus, that is what the alternative hypothesis in Step 1 means.
Discussion