One-Way ANOVA in SPSS
This tutorial shows steps of how you can do One-Way ANOVA in SPSS. One-way ANOVA compares the means of two or more independent groups to determine whether the means are significantly different.
We are going to test whether students of different programs (i.e., vocation, general, and academic) differ in writing scores. Thus, in this example, there are 3 categories. This dataset has been used in some other tutorials online (See UCLA website and another website). You can download the SPSS sav file here.
(Note that: One-way ANOVA can be used to test two categories as well. When there are only two categories, you can either use one-way ANOVA or independent sample t-test.)
Steps of One-Way ANOVA in SPSS
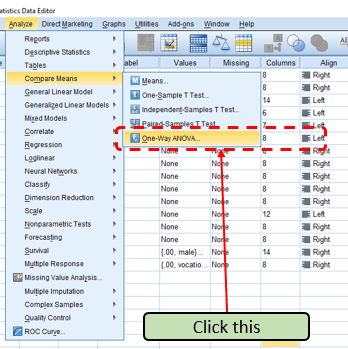
Step 1: Click “One-Way ANOVA”
Click “Analyze”, then “Compare Means”, then “One-Way ANOVA”
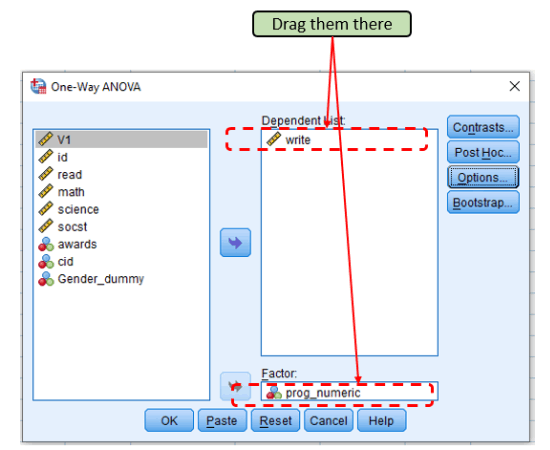
Step 2: Drag variables
Drag “prog_numeric” as Factor and “Write” as “Dependent List.”
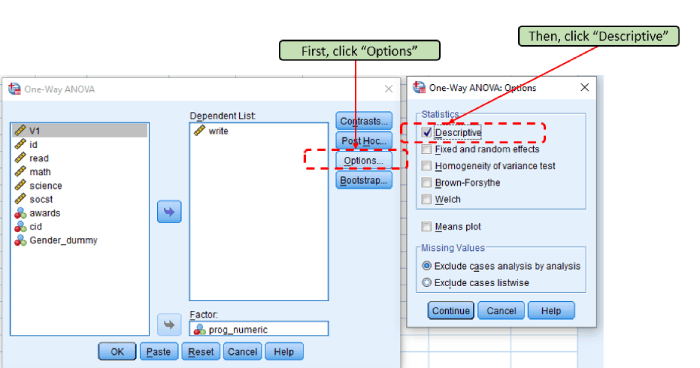
Step 3: Click “Descriptive”
We want to see the means of these 3 categories, thus we click “Descriptive.”
Step 4: Interpret the output
The following are the null and alternative hypotheses for one-way ANOVA.
- Null Hypothesis: Mean_vocation = Mean_general = Mean_academic
- Alternative Hypothesis: At least one pair of Mean_vocation, Mean_general, and Mean_academic is not equal.
After clicking OK in step 3, you will see the following output. We can see that the means for vocation is 46.76, for general is 51.33, and for academic is 56.26. The F(2, 197) = 21.28, p < 0.001. Thus we reject the null hypothesis and conclude that at least one pair of Mean_vocation, Mean_general, and Mean_academic is not equal.
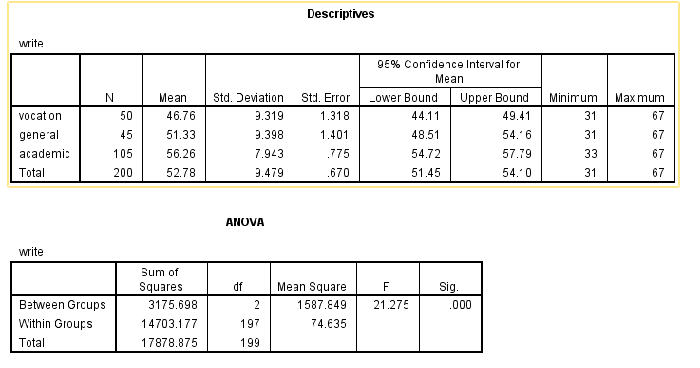
However, we do not know which pair is unequal based on the output shown above. In order to know that, we need to do a post hoc test.
Step 5: Post hoc test for One-Way ANOVA
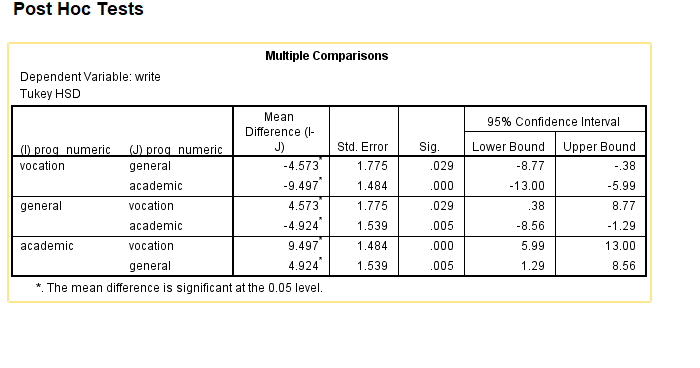
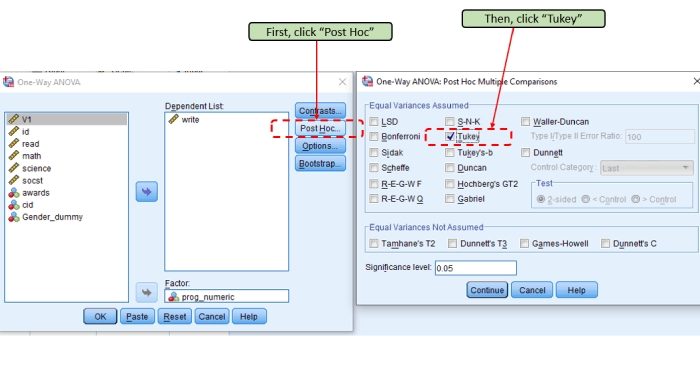
Click “Post Hoc” then “Tukey.” We are going to do a Tukey test to see which pair is significantly different.
The following is the output of the Tukey post hoc test. We can see that all pairs have a p-value that is smaller than 0.05. Thus, all pairs are significant. That means all 3 categories are significantly different from one another.