Two-Way ANOVA in SPSS
This tutorial shows the steps of how you can do two-way ANOVA in SPSS. A two-way ANOVA is used to estimate how a quantitative variable (i.e., Y) changes according to the levels of two categorical variables (X1 and X2).
This tutorial uses hypothetical data of brand (X1) and City (X2) and sales as Y. You can download the data using this link.
Steps of two-way ANOVA in SPSS
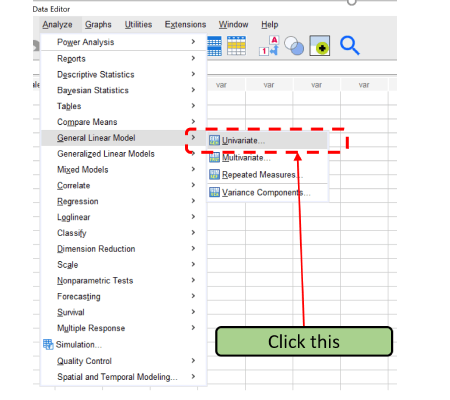
Step 1: Select “Univariate”
“Analyze”, then “General Linear Model”, then “Univariate.”
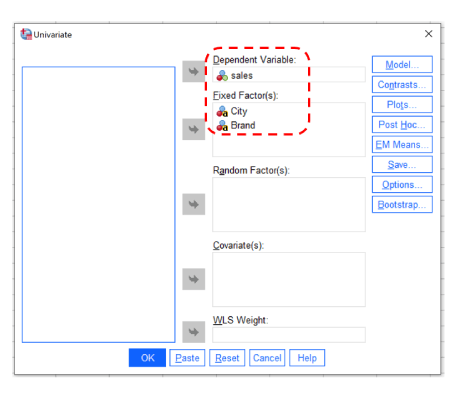
Step 2: Drag variables
Drag variables of City and Brand as Fixed Factor(s) and sales as Dependent Variable.
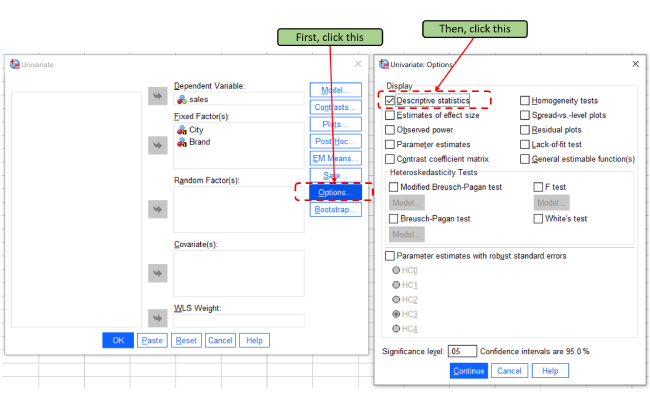
Step 3: Click “Descriptive statistics”
Click “Options” then “Descriptive statistics.” Then, click “Continue” and “OK.”
Step 4: Interpret the output
The following is the output. The interaction effect is F(1, 19) = 6.34, p = 0.023. Thus, the interaction of Brand * City is significant.
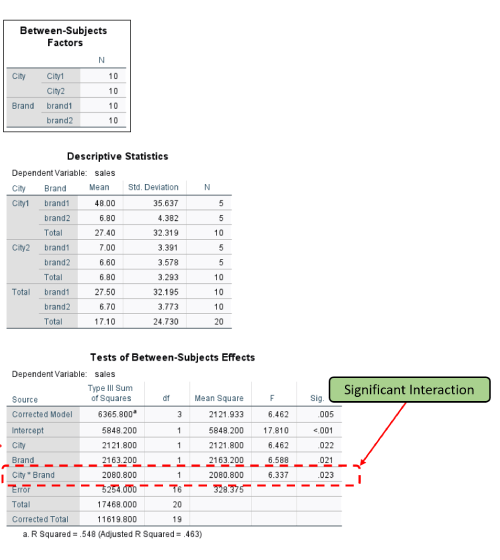
However, what does it mean by saying that the interaction effect is significant? We need to put the 4 means into a table to better understand it. These 4 means are from the table of “Descriptive Statistics.” We can use the following table to better summarize the results.
| City 1 | City 2 | |
| Brand 1 | 48.0 | 7.0 |
| Brand 2 | 6.8 | 6.6 |
| Difference between Brand 1 and Brand 2 | 48.0-6.8=41.2 | 7.0-6.6=0.4 |
For City 1, the sales difference between Brand 1 and Brand 2 is 41.2. For City 2, the difference is 0.4. Therefore, a significant interaction means that 41.2 and 0.4 are statistically significant.
Step 5: Plot Interaction for two-way ANOVA
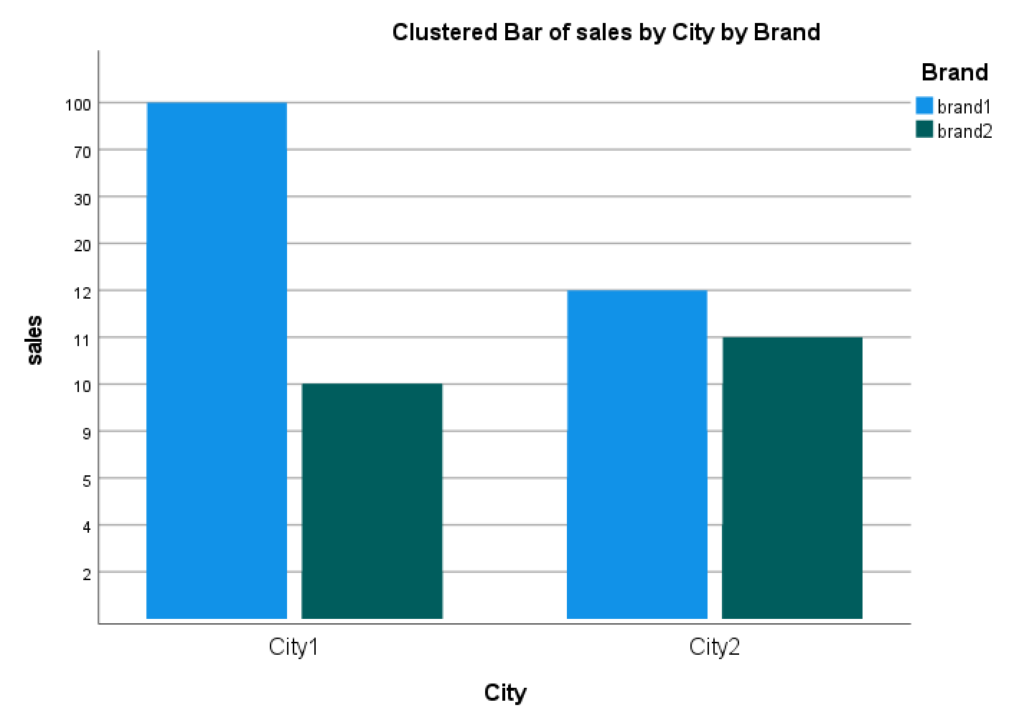
We can further plot the interaction for two-way ANOVA in SPSS. Such a plot can better help us understand the nature of the interaction. The following is the plot. Regarding how to plot it, please refer to another tutorial here.
Further Reading
The following tutorials are in SPSS: