Interaction between Categorical and Continuous Variables in SPSS
This tutorial is to show how to do a linear regression for the interaction between categorical and continuous variables in SPSS.
We are going to use the dataset called hsbdemo, and this dataset has been used in some other tutorials online (See UCLA website and another website). You can download the SPSS sav file here.
The following is the model to test.
write = b0 + b1 socst + b2 female + b3 socst *female
| Variable name in SPSS | DV vs. IVs | data type | Meaning |
|---|---|---|---|
| write | DV | numeric | writing scores |
| female | IV1 | String | female, male |
| socst | IV2 | numeric | test score for social studies |
Step 1: Create a dummy coding variable
In order to know the slope for males and females separately, we need to use dummy coding for the female variable.
The following syntax creates a new variable called Gender_dummy, and sets 1 to represent females and 0 to represent males. Since males = 0, the regression coefficient b1 is the slope for males.
write = b0 + b1 socst + b2 Gender_dummy + b3 socst *Gender_dummy
* recoding female to be dummy coding in a new variable called Gender_dummy.
if female='female' Gender_dummy=1.    /* female
if female='male' Gender_dummy=0.    /* male
execute.

* calculate a new variable for the interaction, based on the new dummy coding.
compute Interaction=Gender_dummy*socst.
execute.
Step 2: Run linear regression model
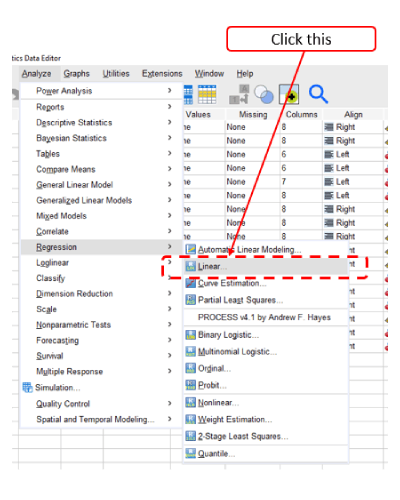
Drag write as Dependent, and drag Gender_dummy, socst, and Interaction in “Block 1 of 1”.
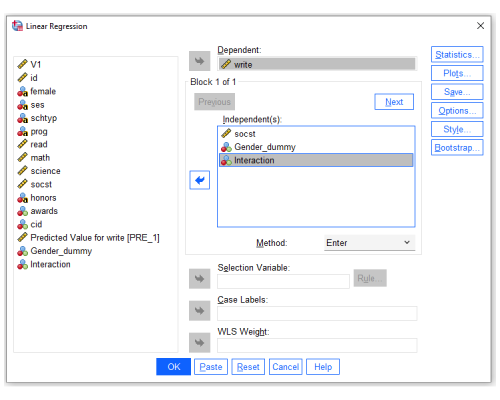
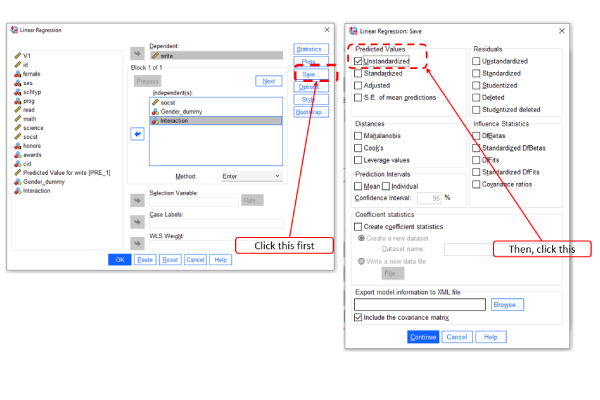
We also want to save the predicted values for plotting the figure later. Thus, click “Save”. Then click “Unstandardized” (see below). Then Click Continue and OK.
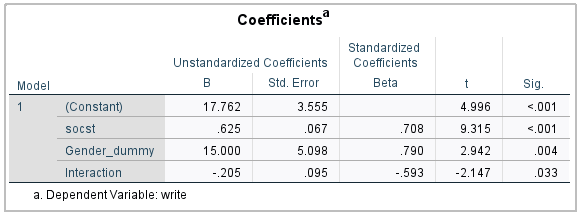
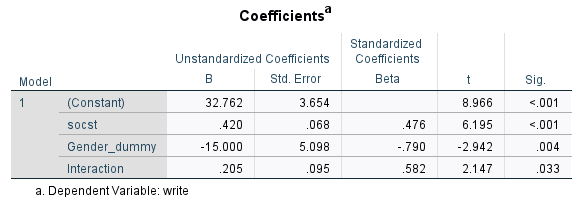
Then, you will get the output shown above. Since the p-value for Interaction is 0.033, it means that the interaction effect is significant.
Further, the regression coefficient for socst is 0.625 (p-value <0.001). It is the regression coefficient for males, since the dummy coding for males =0.
In order to know the regression coefficient for females, we need to change the dummy coding for females to 0 (see the next step).
Step 3: Recode the dummy variable and rerun the linear regression model
The following dummy coding sets 0 for females and 1 for males. Then, we recalculate the Interaction, based on the new dummy coding for Gender_dummy.
* recoding female to be dummy coding in a new variable called Gender_dummy.
if female='female' Gender_dummy=0.    /* female
if female='male' Gender_dummy=1.    /* male
execute.

* calculate a new variable for the interaction, based on the new dummy coding.
compute Interaction=Gender_dummy*socst.
execute.
You can rerun step 2 again, namely the following interface.
You will get the following output. Thus, we know the regression coefficient for females is 0.420 (p-value < 0.001). Thus, we can see that females and males differ in the slope.
Step 4: Plot Interaction between Categorical and Continuous Variables in SPSS
Click the chart builder on the top menu of SPSS, and you need to do the following steps shown below.
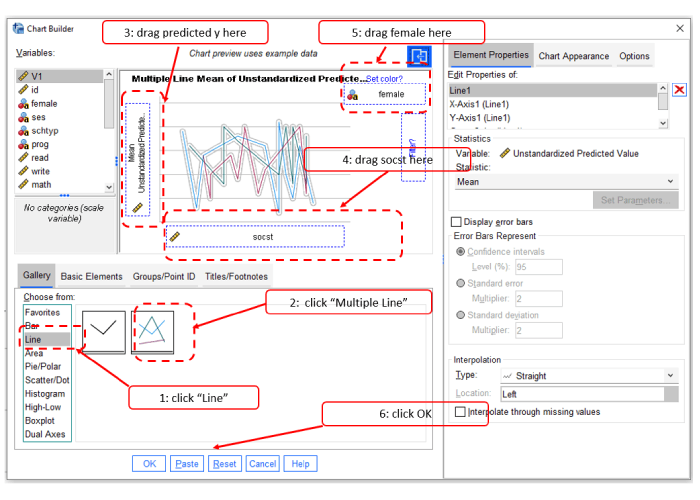
After clicking OK, you will get the following plot.
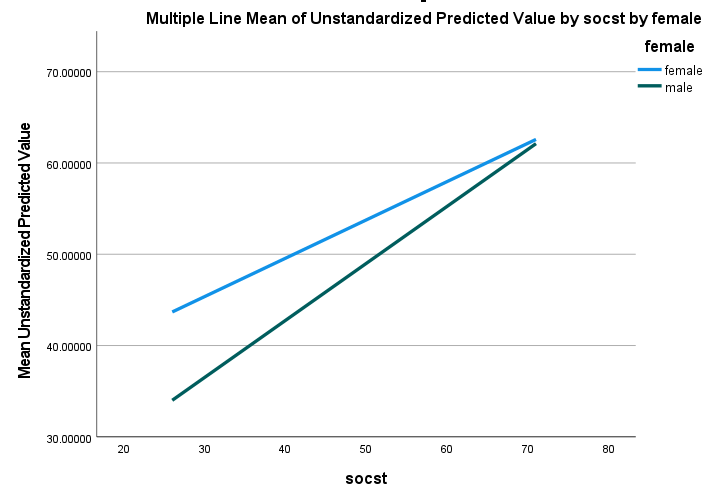
The plot suggests that there is a positive relationship between socst and writing scores. There is a gender difference, such that the slope for males is steeper than for females.
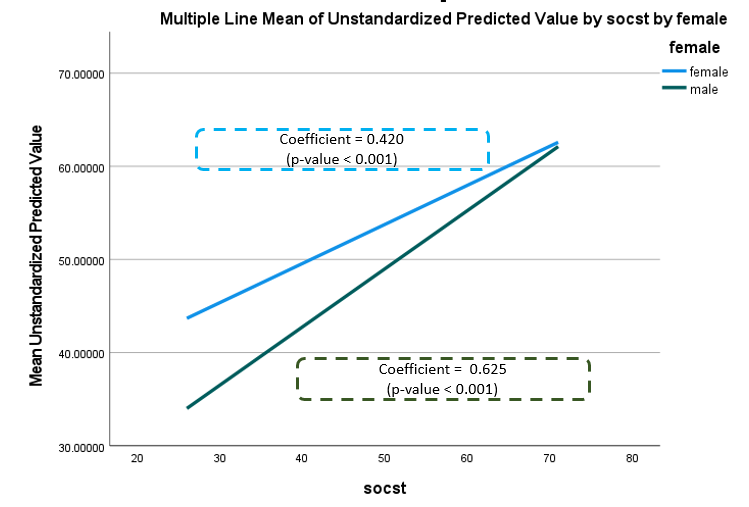
Since now we know the regression coefficients for both males and females from steps 2 and 3, we can add regression coefficients to the interaction plot. Such information can help readers quantitively understand the nature of the interaction.
Instead of using menu interfaces, you can run the following syntax as well. As you can see, it is much easier to use Syntax.
REGRESSION
  /MISSING LISTWISE
  /STATISTICS COEFF OUTS R ANOVA
  /CRITERIA=PIN(.05) POUT(.10)
  /NOORIGIN
  /DEPENDENT write
  /METHOD=ENTER socst Gender_dummy Interaction
  /SAVE PRED.