How Dummy and Contrast Codings Impact P-values in SPSS
This tutorial discusses how dummy and contrast codings impact p-values in SPSS for linear regressions.
Single Categorical Variable
We can start with only one Y (numerical data, or continuous data) and one X (categorical data). We keep it simple to only have 4 observations.
The cell means are (3+4)/2=3.5 vs. (5+6)/2=5.5, and the difference is -2. Further, the mean of these two cell means is (3.5+5.5)/2=4.5. The difference between 3.5 and 4.5 is -1.
| X1 | Y |
| 1 | 3 |
| 1 | 4 |
| 0 | 5 |
| 0 | 6 |
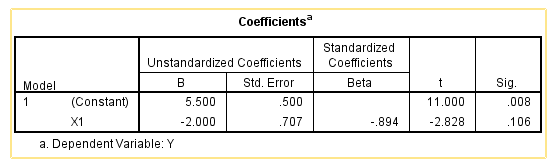
First, we can use the dummy coding, and conduct a simple linear regression in SPSS and the following is the output. For dummy coding, the constant (i.e., intercept) 5.5 is the cell mean with a lower numerical number (i.e., group 0), and the slope -2 is the difference between the two cells.
Second, we can do a contrast coding and the following is the output. For contrast coding, the constant (i.e., intercept) 4.5 is the mean of two cell means, and the slope -1 is the difference between the cell mean with a higher numerical number (i.e., group 1) and the intercept.
| X1 | Y |
| 1 | 3 |
| 1 | 4 |
| -1 | 5 |
| -1 | 6 |
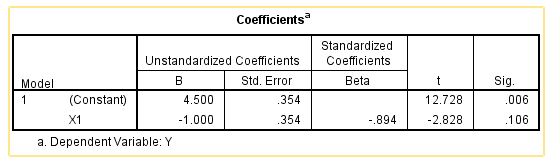
In summary, we conclude that the p-values for the intercept are different between dummy and contrast codings, whereas the p-values for the slope are the same between these two codings.
Thus, if you only care about p-value, you do not need to pay attention to coding. Either coding (dummy or contrast) will give you the same p-value.
Note that, while we use SPSS to conduct analyses here, the conclusions apply to other software. Of course, other software might use different reference levels based on higher or lower grouping numerical numbers.
Categorical and Continuous Variables
In this section, we explore the impact of coding on p-values in multiple linear regressions. That is, the independent variables include categorical (X1) and continuous (X2) data.
| X1 | X2 | Y |
| 1 | 4 | 3 |
| 1 | 6 | 4 |
| 0 | 6 | 5 |
| 0 | 7 | 6 |
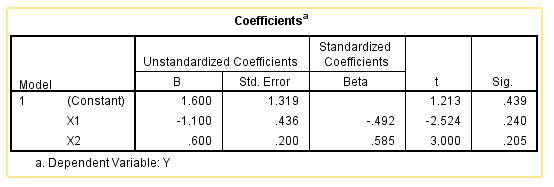
We can get the following output. As we can see the intercept and slope are different from the ones when there is only X1 in the model. This is, when adding the continuous variable X2, we can no longer really directly connect intercept and slope with the value of Y.
Similarly, we can also use contrast coding to test that. The following is the output. We can see the intercept and slope for X1 are different from when there is only X1 in the model.
| X1 | X2 | Y |
| 1 | 4 | 3 |
| 1 | 6 | 4 |
| -1 | 6 | 5 |
| -1 | 7 | 6 |
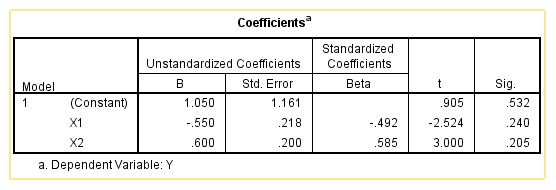
The interesting thing is that, comparing dummy coding and contrast coding, X1 and X2 have the exactly same p-values, even though the p-values for the intercept are different.
Another interesting observation is that, the slope for the continuous independent variable X2 is exactly the same, regardless of dummy coding or contrast coding.
Further Reading
Note that, I intentionally keep this tutorial simple to make it easy to follow. For instance, this tutorial does not discuss the impact from mean-centering, such that how mean-centering can impact slopes and p-values. Further, this tutorial does not discuss the interaction of X1 and X2, because such discussion will really complicate the flow of this tutorial. If you want to know more, you can refer to this tutorial on how dummy coding and contrast coding impact the slope and p-value of interaction (click it).
If you want to know the situation where the categorical variable has 3 levels (rather than 2 levels discussed in this tutorial), you can refer to my other tutorial showing how dummy and contrast codings impact slope and p-value when the categorical variable has 3 levels.
Discussion